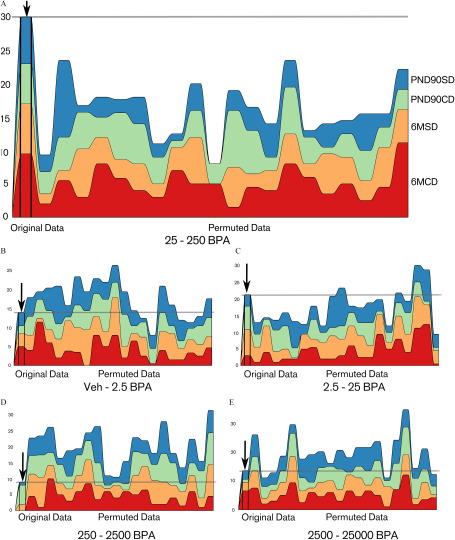
Figure 7.
Number of quantities that have their largest difference between the target consecutive concentration (A) 25–250BPA and the other consecutive concentrations [(B) Veh–2.5BPA; (C) 2.5–25BPA; (D) 250–2500BPA, and (E) 2500–25000BPA] for the data sets PND90SD, PND90CD, 6MSD, and 6MCD. Units: body weight (BW) per day. In each graph: left, original data, right 20 data sets obtained by random permutation of the condition of each animal. The sum of these quantities (gray horizontal line) is higher with the original data set than with each one of the 20 permuted data sets. Note: BPA, bisphenol A; CD, continuous-dose; Control, vehicle control; M, month; PND, postnatal day; SD, stop-dose.

