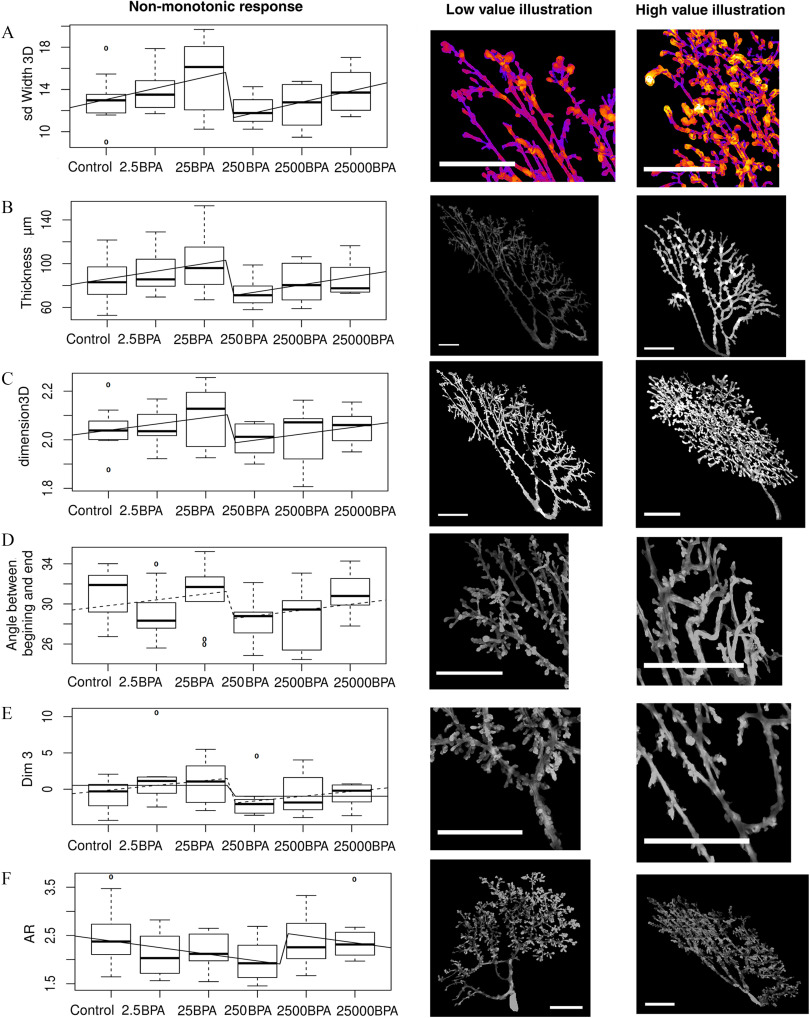
Figure 8.
Nonmonotonic responses to BPA doses [x-axis, BPA body weight (BW) per day] shown by nonlinear regression in PND21C animals and illustration of the corresponding morphological features. Number of animals per group . Units: BW per day. The midline represents the median, the box represents the quartiles above and below the median, and the whiskers represent the two other quartiles, excluding outliers. (A–F) Graphs representing mean and standard deviation for each dose and the fit with the combination of a linear and step function. Left photomicrograph panels are representative images of a low value, right panels illustrate high values. . All features but the aspect ratio (F) show a break between 25BPA and 250BPA. In (F) the break is between 250BPA and 2500BPA. (A) Mean variation of ductal thickness: the gland on the right has many structures that have both thin and thick parts, whereas the gland on the left has more regular structures. (B) Mean thickness of the epithelium: the brightness in the pictures is proportional to the local thickness of the points of the gland. (C) Fractal dimension in 3D. The gland on the right grows more conspicuously in the third dimension than in the left figure. (D) Angle between the beginning and the end of ducts: ducts are straighter on the left and turn more on the right. (E) Third dimension from PCA. (F) AR: A large AR leads to an elongated gland, whereas a low AR means that the gland is round. Low doses of BPA increase the roundness of glands and high doses lead to an AR similar to control. Note: AR, aspect ratio; BPA, bisphenol A; Control, vehicle control; PCA, principal component analysis; PND, postnatal day; 3D, three-dimensional.

