. 2020 May 15;128(5):057005. doi: 10.1289/EHP7200

Figure 3.

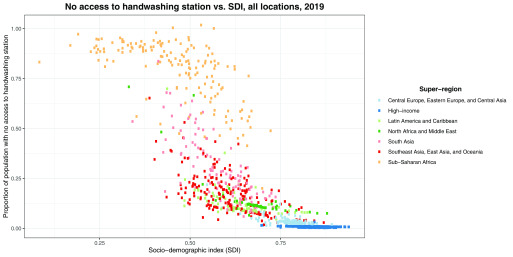
Figure 3 is a scatterplot titled No access to handwashing station versus S D I, all locations, 2019, plotting proportion of population with no access to handwashing station, ranging from 0.00 to 1.00 in increments of 0.25 (y-axis) across sociodemographic index (S D I), ranging from 0.25 to 0.75 in increments of 0.25 (x-axis) for super-regions, namely, Central Europe, Eastern Europe, and Central Asia; High-Income; Latin America and Caribbean; North Africa and Middle East; South Asia; Southeast Asia, East Asia, and Oceania; and Sub-Saharan Africa.

Estimated relationship between no access to a handwashing station with soap and water and SDI, by GBD region, 2019. Note: GBD, Global Burden of Diseases Injuries, and Risk Factors Study; SDI, sociodemographic index.