. 2020 May 18;128(5):057006. doi: 10.1289/EHP6012

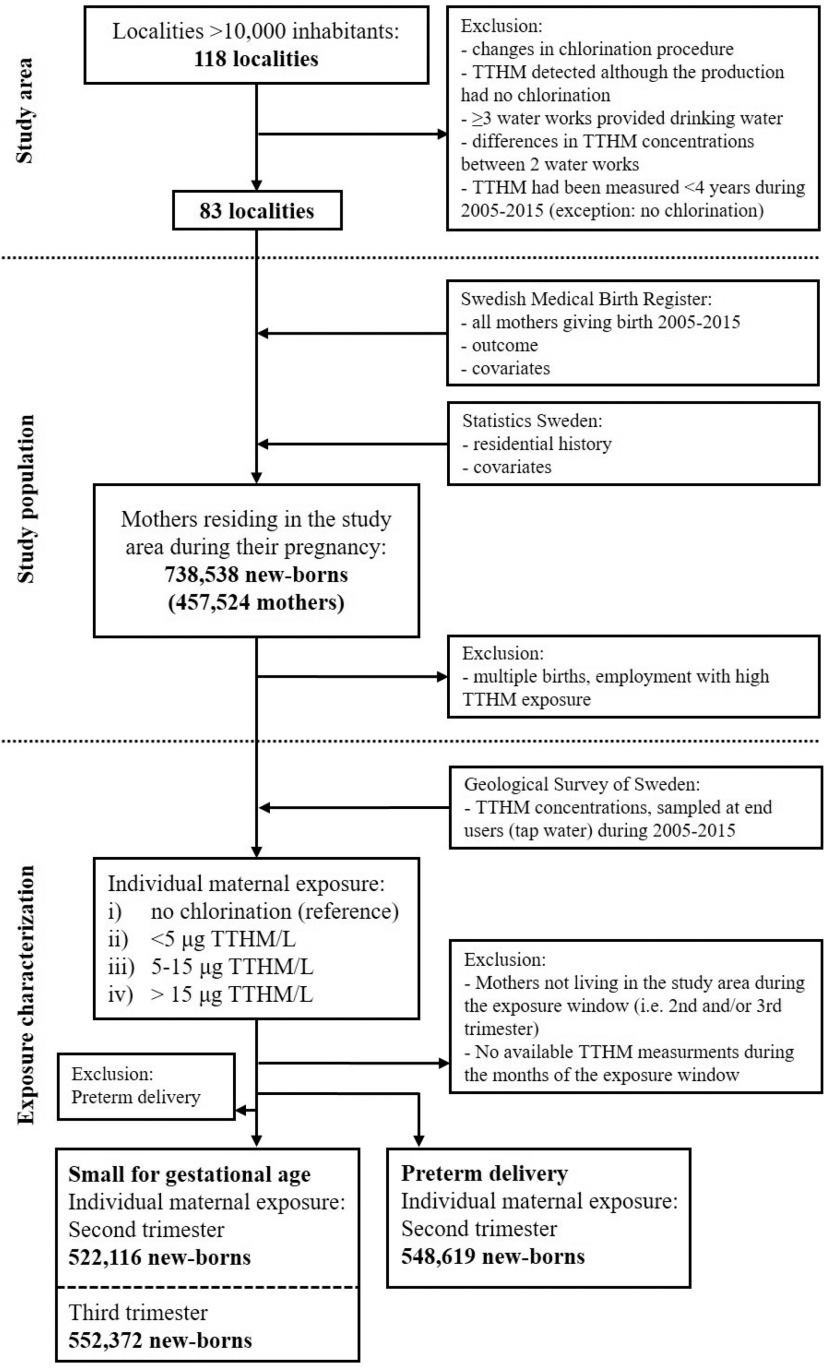
Figure 1.

Figure 1 is a flow chart, starting with Localities greater than 10,000 inhabitants connected to 83 localities on exclusion of Changes in chlorination procedure, TTHM detected although the production has no chlorination, greater than or equal to 3 waterworks provided drinking water, differences in TTHM concentration between two waterworks, and TTHM had been measured less than 4 years during 2005 to 2015 (exception: no chlorination). The 83 localities by including Swedish Medical Birth Register: all mothers giving birth 2005 to 2015, outcome, and covariates and Statistic Sweden: residential history and covariates is connected to mothers residing in study area during their pregnancy: 738,538 newborns (457,524 mothers), which is connected to individual maternal exposure: no chlorination (reference), less than 5 micrograms TTHM per liter, 5 to 15 micrograms TTHM per liter, and greater than 15 micrograms TTHM per liter on exclusion of multiple births, employment with high TTHM exposure. Individual maternal exposure leads to preterm delivery, Individual maternal exposure: second trimester 548,619 newborns on exclusion of mothers not living in the study area during the exposure window (i.e., second and or third trimester) and no available TTHM measurements during the months of the exposure window and to small for gestational age individual maternal exposure: second trimester 522,116 newborns and third trimester 552,372 newborns on exclusion of preterm delivery. The flowchart is divided into 3 parts; the part till 83 localities is labeled Study area, till mothers residing in study area during their pregnancy: 738,538 newborns (457,524 mothers) and its exclusion is labeled Study and population, and beyond it is labeled exposure characterization.

Study area, study population, and exposure categorization (average of the four most common trihalomethanes). Note: TTHM, total trihalomethanes.