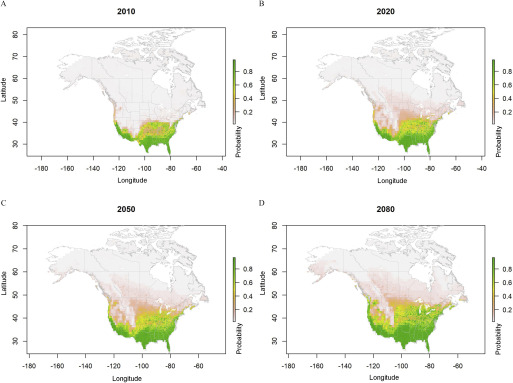
Figure 3.
Predicted probabilities for Aedes aegypti ecological niche areas based on ensemble model simulations using four regional climate model data sets (CanRCM4-CanESM2, CRCM5-CanESM2, CRCM5-MPI-ESM-LR, and HIRHAM5-EC-EARTH), under representative concentration pathway (RCP) 8.5, from the year 2006 to 2100. Estimated probabilities shown for (A) 2010, (B) 2020, (C) 2050, and (D) 2080 are climatological conditions averaged over the 2006–2016, 2011–2040, 2041–2070, and 2071–2100 periods, respectively.

