
Fig. 2.
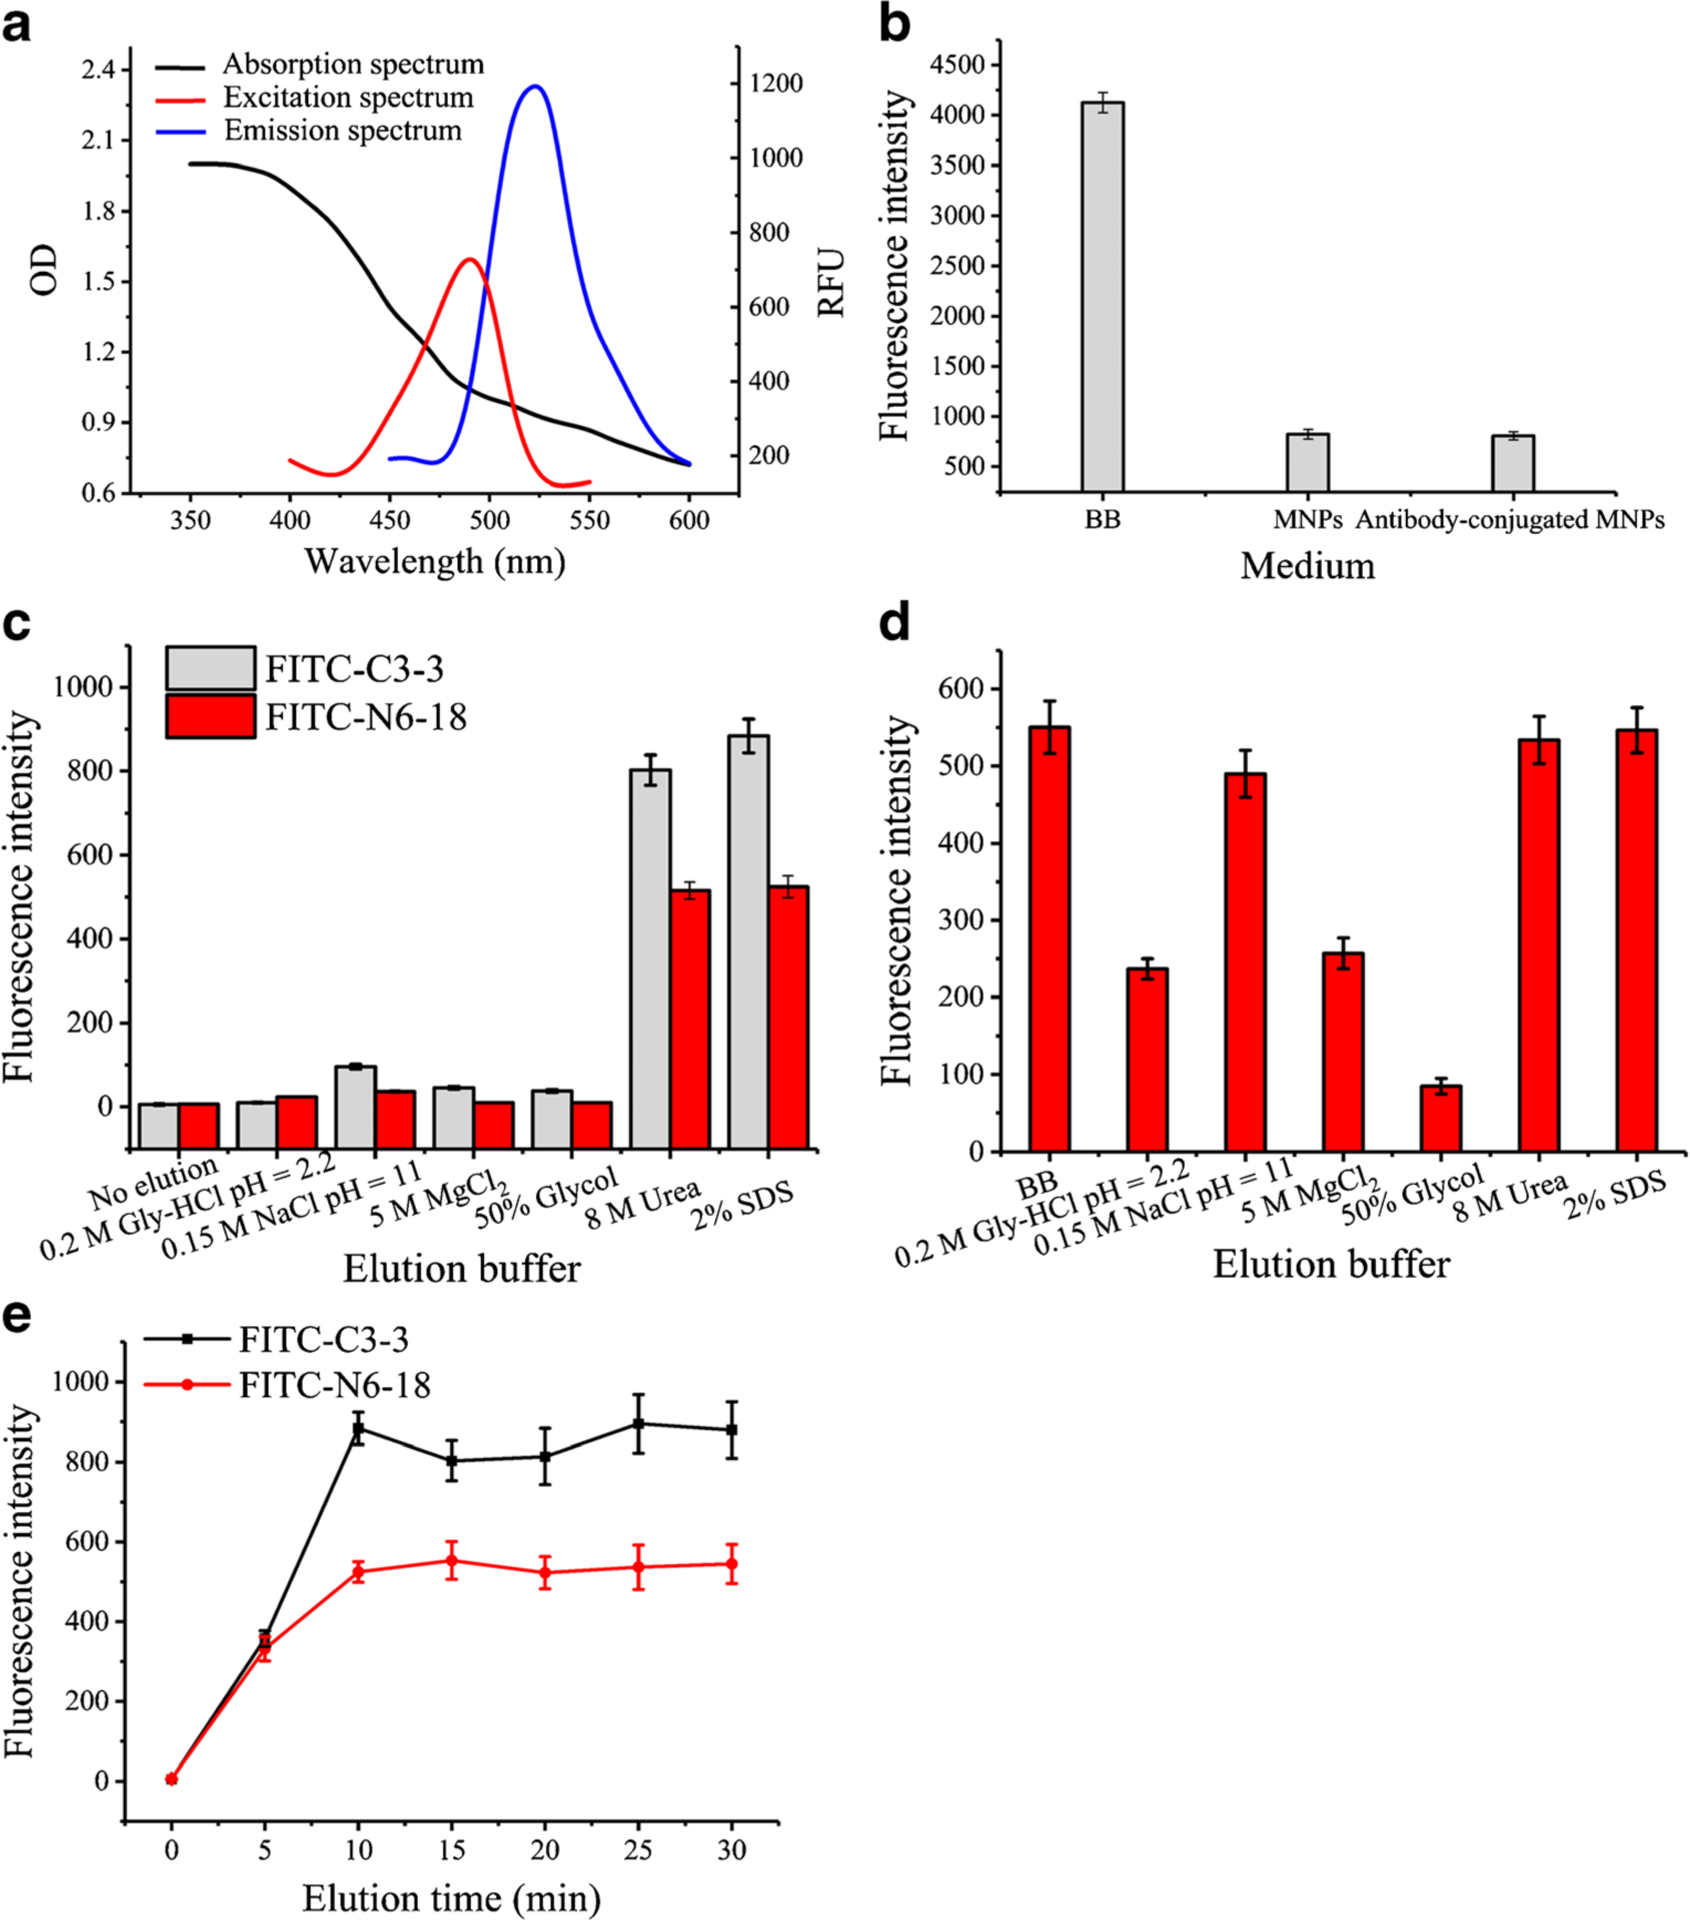
The absorption spectrum of MNPs (black curve), and excitation and emission spectra of tracer FITC-C3–3 (red and blue curves) (a); the fluorescence intensity of tracer FITC-C3–3 in BB, MNPs, and mAb-conjugated MNPs (b); the fluorescence intensity after eluted by 0.2 M Gly-HCl (pH = 2.2), 0.15 M NaCl (pH = 11), 5 M MgCl2, 50% Glycol, 8 M urea, and 2% SDS (c); the fluorescence intensity of tracer FITC-C3–3 at same concentration in different elution buffer (d); the fluorescence intensity at different elution times with 2% SDS (e)