
Figure 12:
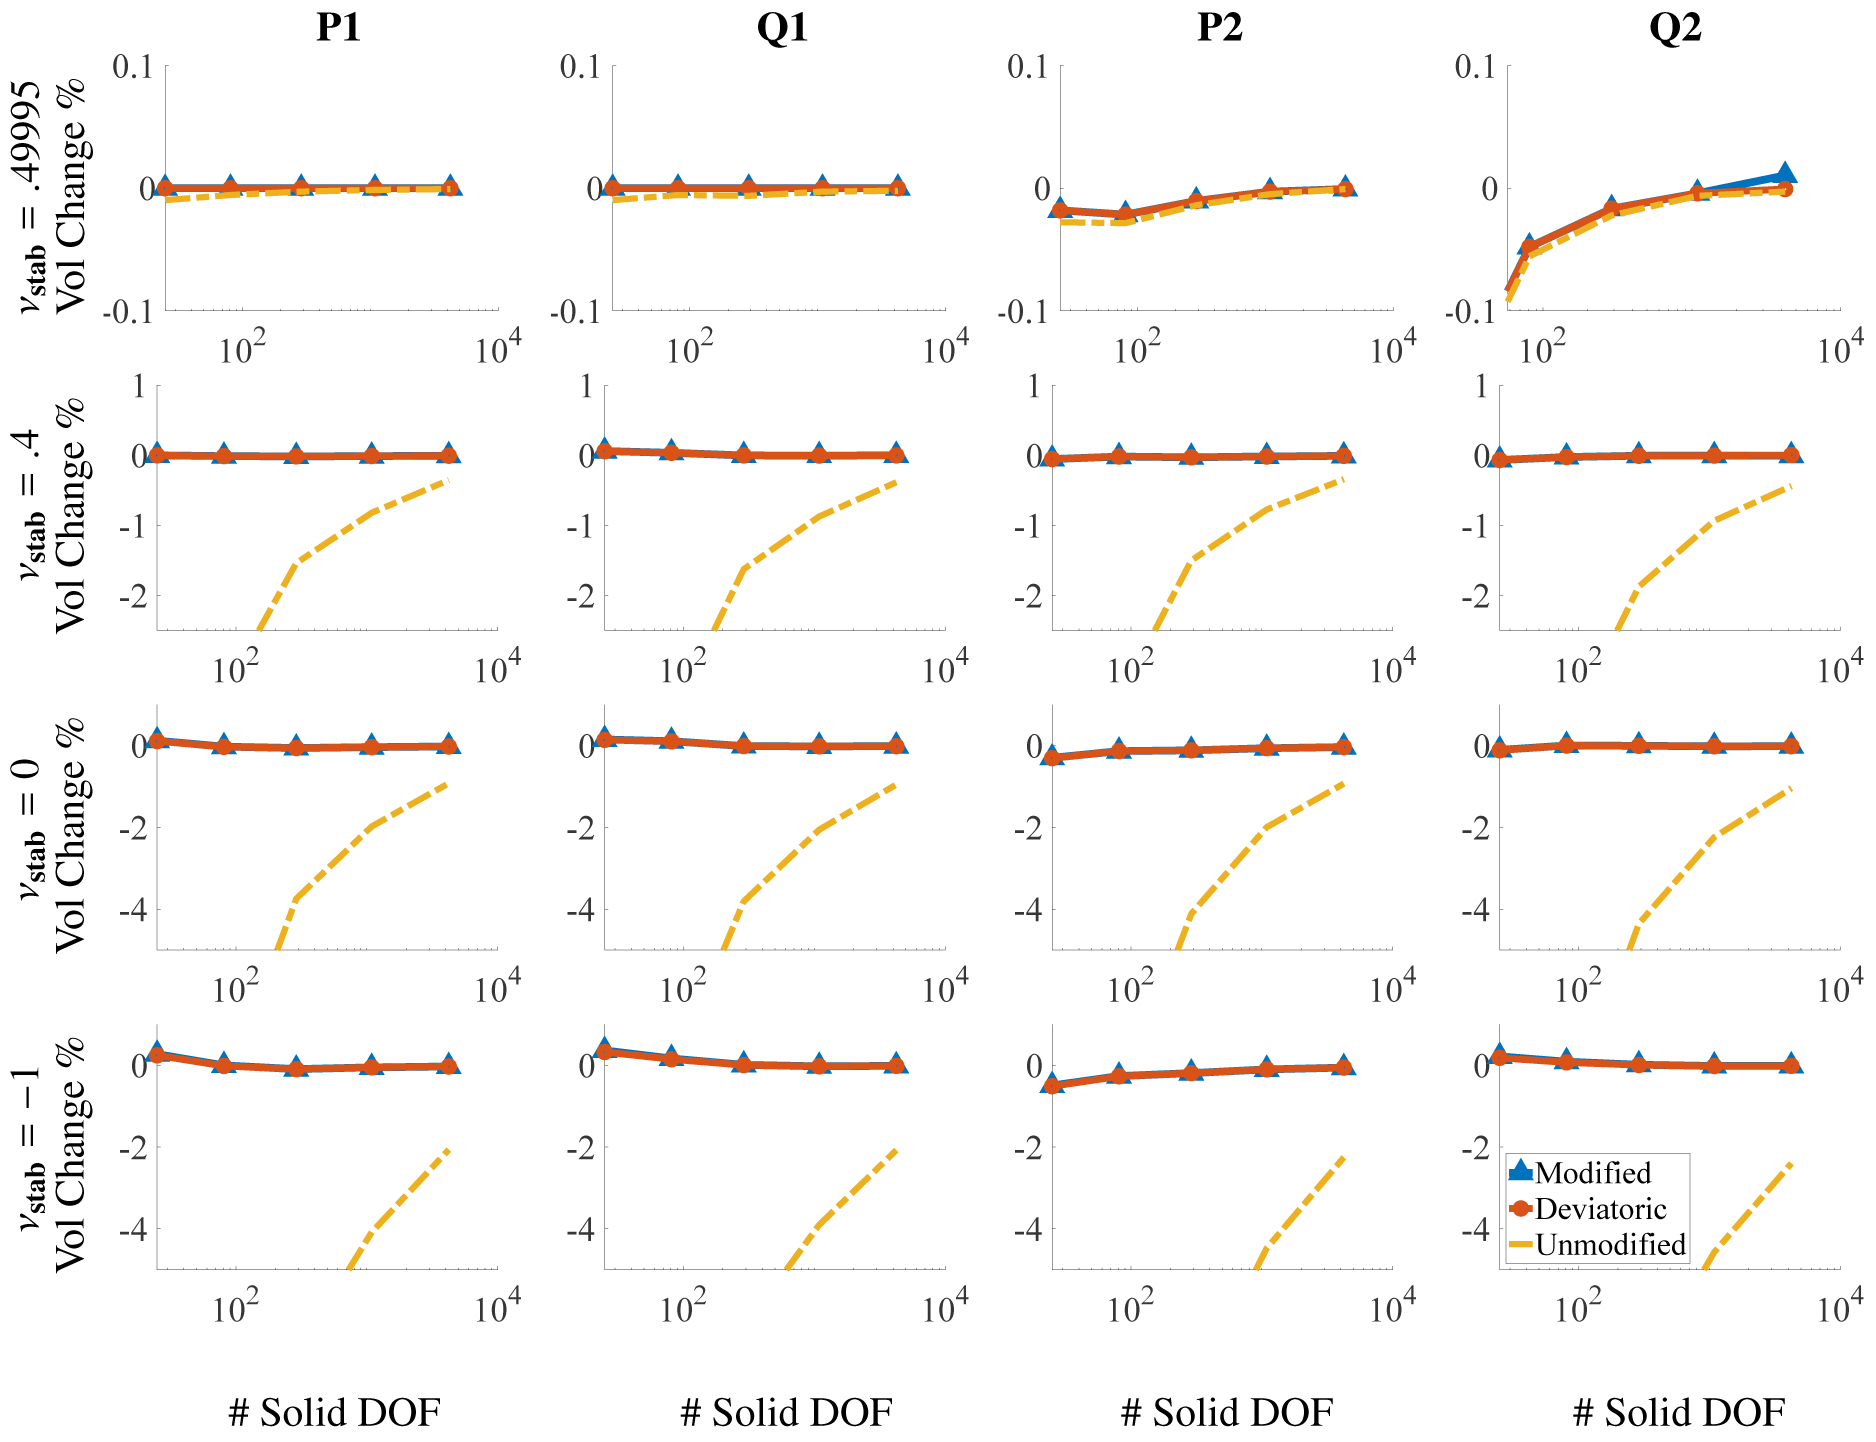
Percent change in total area for different numbers of solid DOF for the Cook’s membrane benchmark (Section 4.2) after deformation. The DOF range from m = 25 to 4225, and the x axis is on a log scale. Note the different scales on the y-axes. Omitting the coarsest discretizations (m = 25), the largest deviations in total area among all element types used are approximately .10% for the modified case, 7.45% for the unmodified case, and .10% for the deviatoric case.