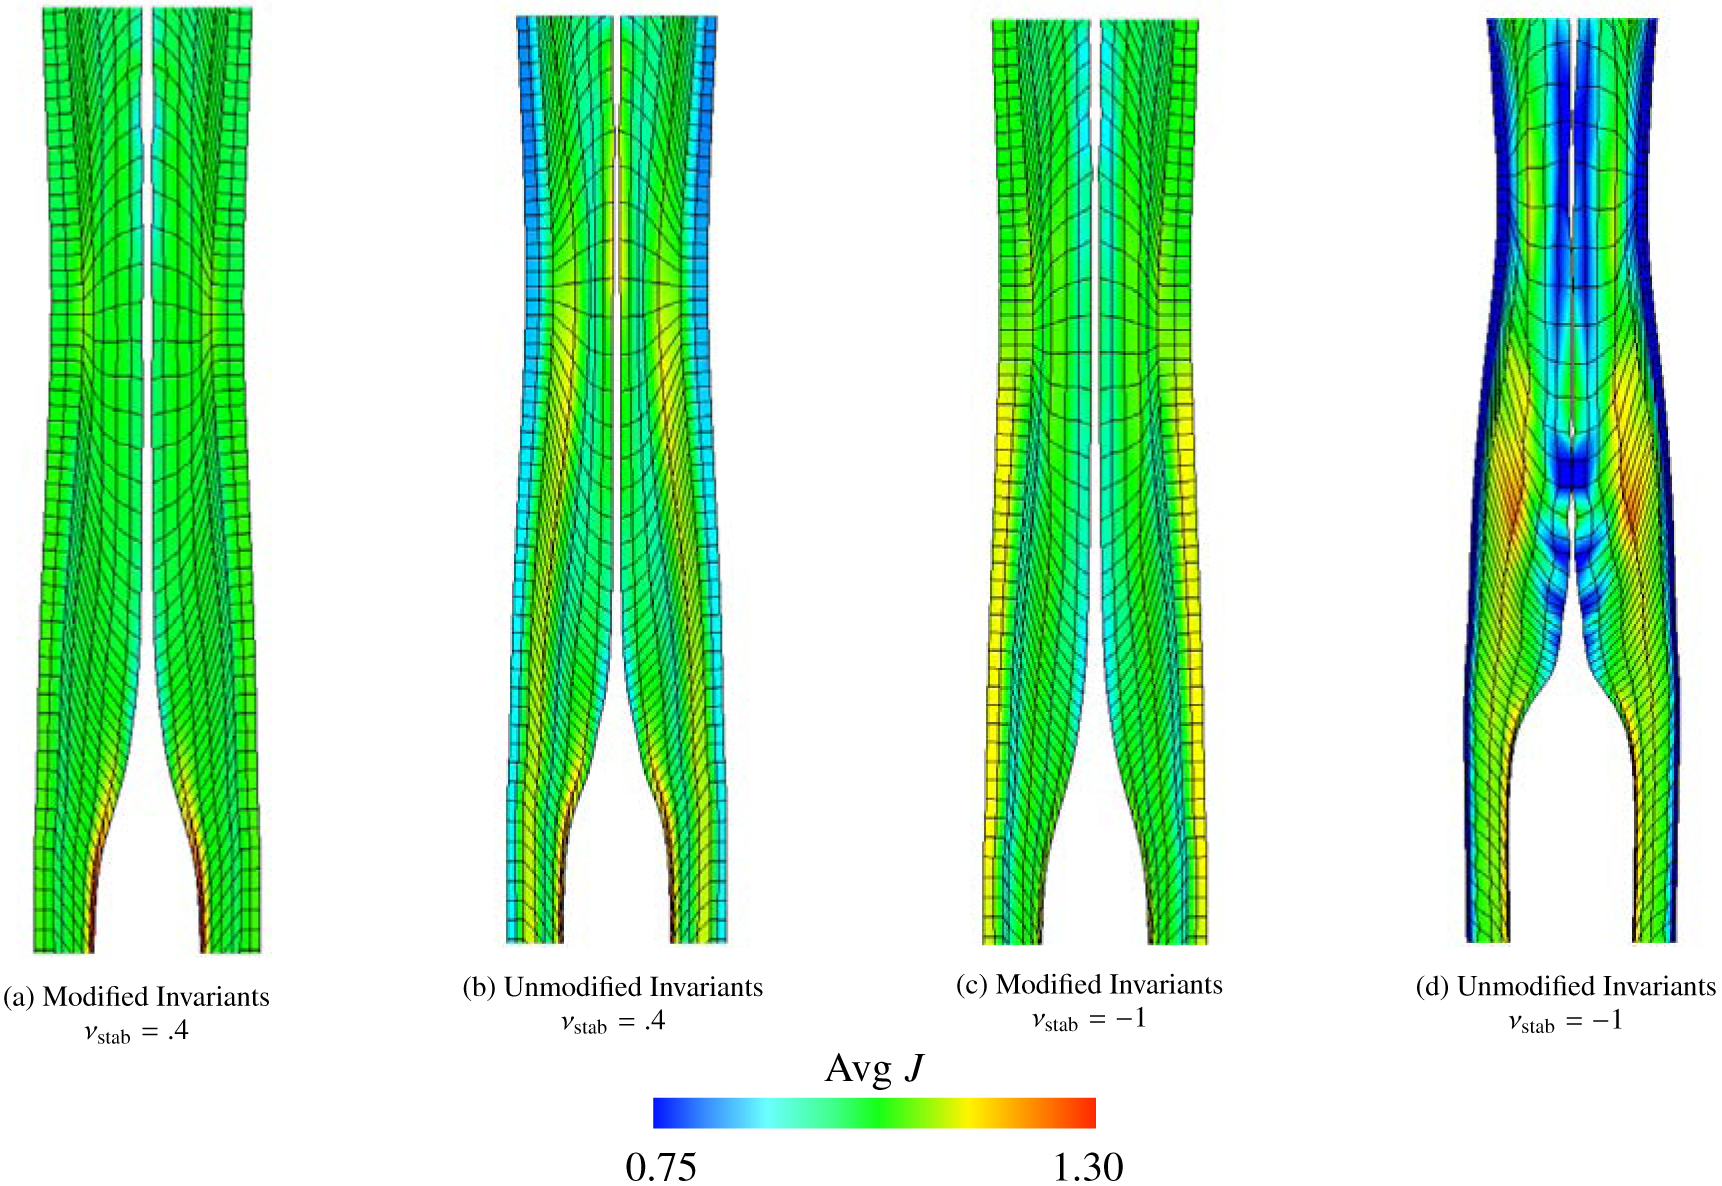
Figure 37:

Deformation fields and mean values of J of the esophageal transport model (Section 5) behind the bolus at t = 0.8 s. Here the differences between each case is less pronounced, but note the wider distribution of J as found in panel (d) as compared to panel (a).
