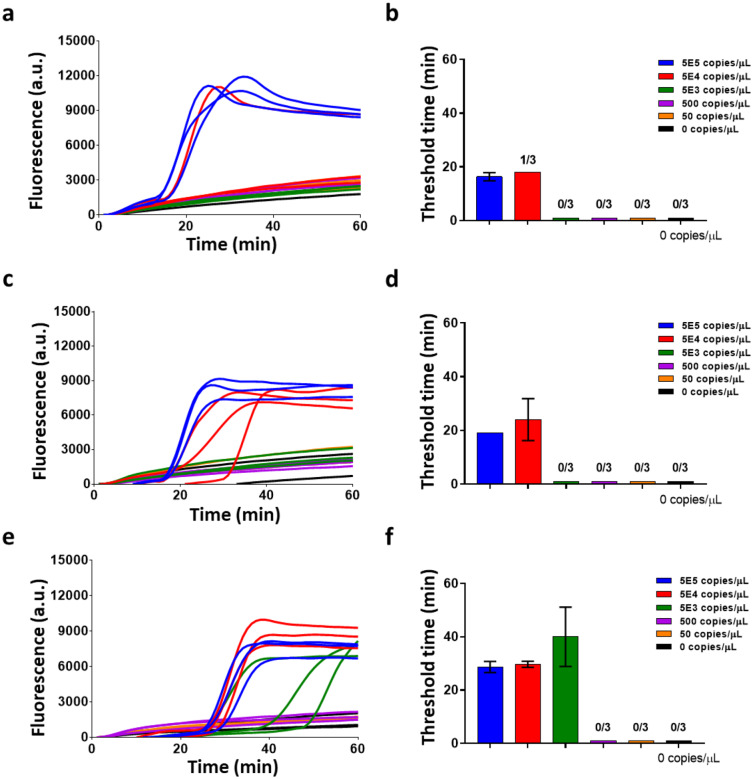
Fig. 4. Characterization of SARS-CoV-2 virus in Nasal Fluid.
(a-b) Raw fluorescence data and amplification threshold times (for 3 replicates of data) for viral detection in a 16 μL reaction with 12.5% spiked nasal fluid per reaction. (c-d) Raw fluorescence data and amplification threshold times (for 3 replicates of data) for viral detection in a 16 μL reaction with 25% spiked nasal fluid per reaction. (e-f) Raw fluorescence data and amplification threshold times (for 3 replicates of data) for viral detection in a 16 μL reaction with 50% spiked nasal fluid per reaction. The bar graphs show mean and standard deviation.

