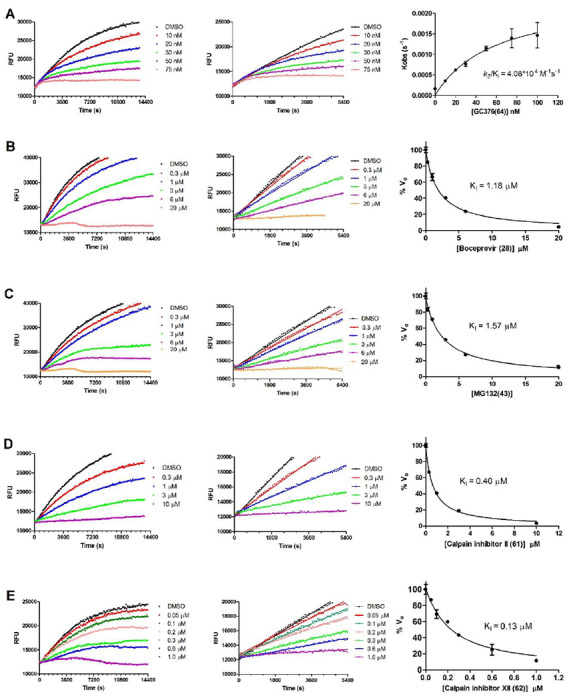
Figure 4: Proteolytic reaction progression curves of Mpro in the presence or the absence of compounds.

In the kinetic studies, 5 nM Mpro was added to a solution containing various concentrations of protease inhibitors and 20 μM FRET substrate to initiate the reaction, the reaction was then monitored for 4 hrs. Left column shows the reaction progression up to 4 hrs; middle column shows the progression curves for the first 90 minutes, which were used for curve fitting to generate the plot shown in the right column. Detailed methods were described in the Method section. (A) GC-376 (64); (B) Boceprevir (28); (C) MG-132 (43); (D) Calpian inhibitor II (61); (E) Calpain inhibitor XII (62).
