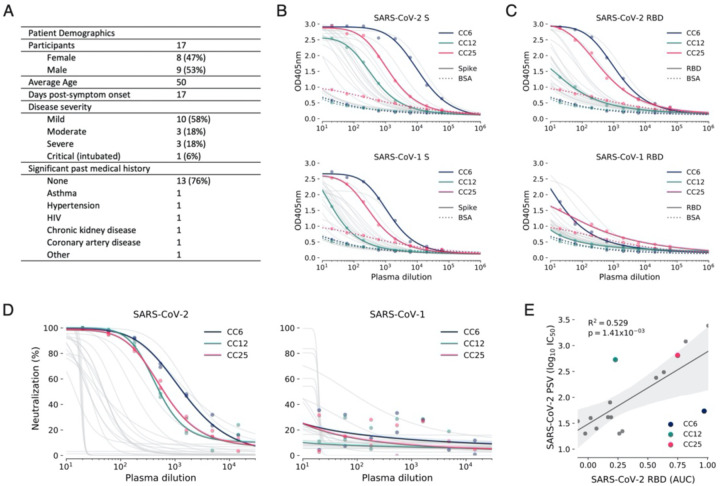
Figure 2. COVID-19 cohort functional screening.
(A) Demographics of the UCSD COVID-19 cohort (CC) participants. CC plasma were tested for binding to SARS-CoV-1 and SARS-CoV-2 S protein (B) and RBD subunit (C) by ELISA. Background binding of plasma to BSA-coated plates is represented by a dashed line. (D) Plasma were also tested for neutralization of pseudotyped (PSV) SARS-CoV-1 and SARS-CoV-2 virions. (E) Correlation between PSV SARS-CoV-2 neutralization and RBD subunit ELISA binding area-under-the-curve (AUC). AUC was computed using Simpson’s rule. The 95% confidence interval of the regression line is shown in light grey and was estimated by performing 1,000 bootstrap re-samplings. R2 and p values of the regression are also indicated. CC participants from whom mAbs were isolated are specifically highlighted in dark blue (CC6), pine green (CC12) and hot pink (CC25).

