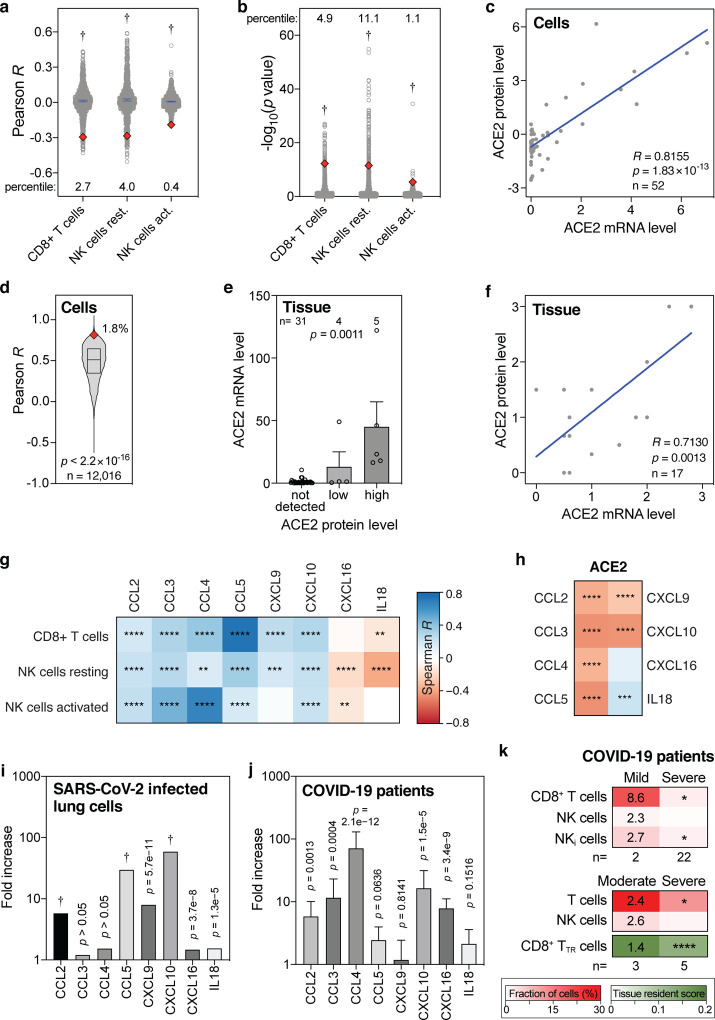
Figure 2. Levels of ACE2 mRNA, ACE2 protein, CD8+ T cells, NK cells and cytokines in lung cells, lung tissues and COVID-19 patient samples.
(a, b) Pearson R and −log10(p values) of correlations between 1000 randomly sampled genes and the levels of indicated lymphocytes in lung tissues were determined and plotted. ACE2 Pearson R and p values are shown as red diamonds. Blue lines indicate means with 95% confidence intervals. Percentiles for ACE2 with respect to the 1000 random R and p values are shown. Data are from the GTEx dataset (n=578). P values: one-sample t tests. (c) Correlations between ACE2 mRNA and protein levels in 52 cell lines. R and p values: Pearson correlations. (d) Pearson correlation R values between mRNA and protein levels of 12,016 genes are compared to the ACE2 R coefficient (red diamond). The box represents the median and interquartile range. The ACE2 R percentile is also shown. P value: one-sample t test. (e) Bar graph showing the correlation between ACE2 mRNA and protein levels in human tissues. Means with standard errors of the means are shown. Samples are from the Human Protein Atlas. P value: Kruskal-Wallis test. (f) Meta-analysis scatter plot showing the correlation between ACE2 mRNA and protein levels in 17 human tissues. Data are from 9 different studies, as detailed in Table S4. P value: Pearson correlation. (g, h) Heatmaps showing Spearman correlations between the levels of ACE2 or indicated cytotoxic lymphocytes and eight cytokines that recruit these cells in human lung tissues from the GTEx dataset (n=578). Colors of tiles represent Spearman R, as per scale bar on the right. Spearman significance levels are shown by asterisks. See also Fig. S5. (i, j) Fold increase in expression levels of indicated cytokines in Calu-3 lung cells 24 hours after SARS-CoV-2 infection compared to uninfected Calu-3 cells (i), and in post-mortem COVID-19 lung tissues (n=2) to those in healthy, uninfected lung tissues (n=2) (j). (k) Comparison of indicated fractions of lymphocyte levels in bronchoalveolar lavages of mild/moderate and severe COVID-19 patients, as determined in two separate studies (46, 47). The second also determined a tissue resident (TR) score for CD8+ T cells. Numbers in the mild/moderate column on the left show fold increase compared to the respective severe cases on the right. Asterisks in the severe column on the right represent statistical significance levels, as determined my Mann-Whitney U tests (top panel), or t tests (middle and bottom panels) comparing mild/moderate to severe cases. P value abbreviations: *, p<0.05; **, p<0.01; ***, p<0.001; ****, p<0.0001; †, p<2.2×10⁻¹⁶.

