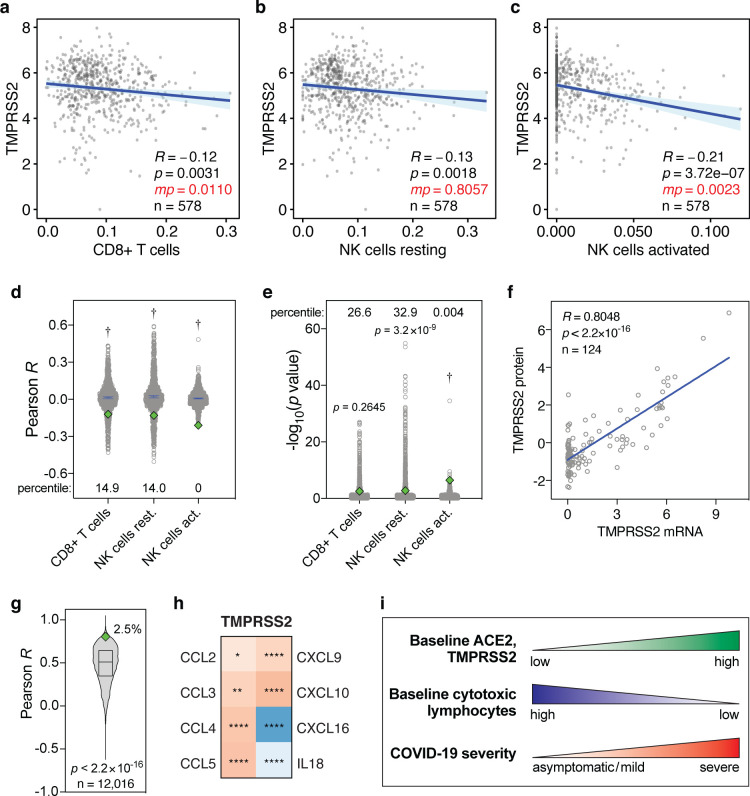
Figure 3. Levels of TMPRSS2 mRNA, TMPRSS2 protein and cytokines in lung cells and tissues.
(a-c) Pearson correlations between baseline levels of indicated lymphocytes and TMPRSS2 in human lung tissue, as Figure 1a–c. Data are from the GTEx dataset (n=578). (d, e) Pearson R and −log10(p values) of correlations between 1000 randomly sampled genes and the levels of indicated lymphocytes in lung tissues, as in Figure 2a,b. TMPRSS2 Pearson R and p values are shown as green diamonds. (f) Correlations between TMPRSS2 mRNA and protein levels in 124 cell lines. R and p values: Pearson correlations. (g) Pearson correlation R values between mRNA and protein levels of 12,016 genes are compared to the TMPRSS2 R coefficient (green diamond). The box represents the median and interquartile range. The TMPRSS2 R percentile is also shown. P value: one-sample t test. (h) Heatmap showing Spearman correlations between the levels of TMPRSS2 and cytokines in human lung tissues from the GTEx dataset (n=578), as in Figure 2h. (i) Individuals with high baseline levels of ACE2 and TMPRSS2 show low baseline tissue-resident levels of cytotoxic lymphocytes in the lung. We propose that this may jointly predispose these individuals to development of severe COVID-19.

