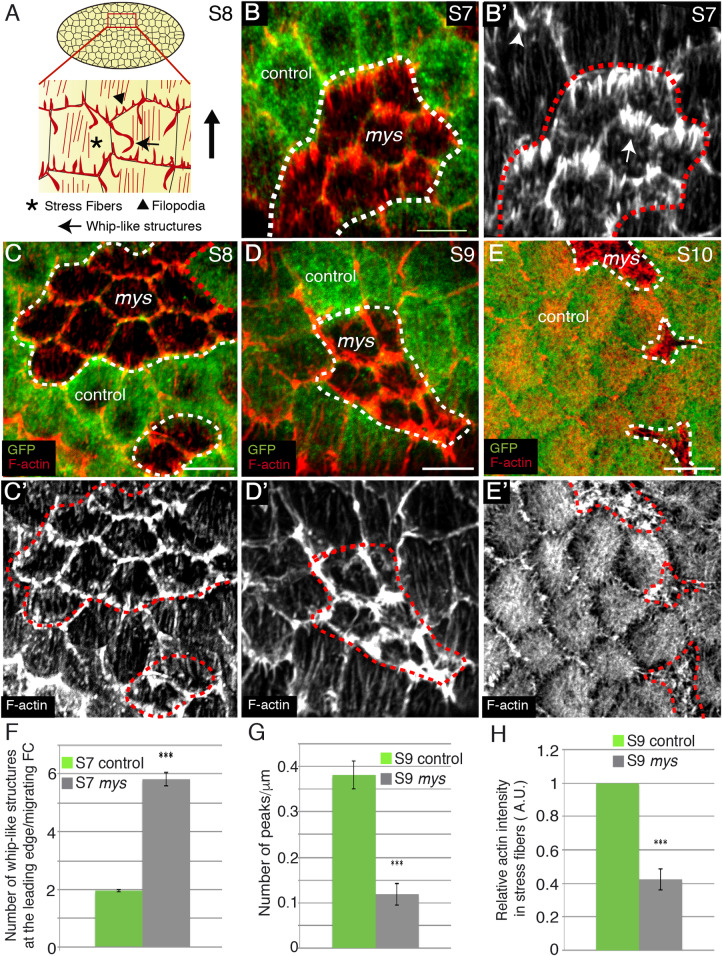
Fig 1. Integrins regulate whip-like structures and stress fibers formation.
(A) Schematic drawing of a S8 egg chamber illustrating the different types of actin organisations found on the basal side of FCs. (B-E’) Basal surface view of mosaic S7 (B, B’), S8 (C, C’), S9 (D, D’) and S10 (E, E’) egg chambers containing mys FC clones, stained for anti-GFP (green) and Rhodamine Phalloidin to detect F-actin (red). (B, B’) mys FCs (GFP-negative) contain more whip-like structures (arrow in B’) than control FCs (GFP-positive, arrowhead in B’). (C-E’) Stress fiber number diminishes progressively from S8-10 in mys FCs. (F) Quantification of the number of whip-like structures at the leading edge of S7 control and mys migrating FCs. (G) Quantification of the number of actin fibers per μm in S9 control and mys FCs. (H) Quantification of relative F-actin intensity in stress fibers in S9 control and mys FCs. The statistical significance of differences was assessed with a t-test, *** P value < 0.0001. All error bars indicate s. e. Scale bars, 5 μm. The dotted white and red circles indicate area occupied by clones of mutant cells.

