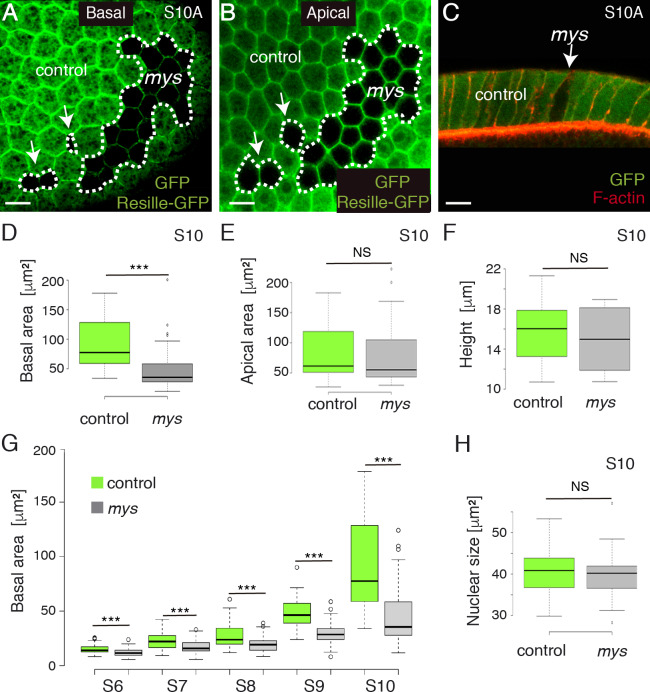
Fig 4. mys mutant FCs show defective basal surface expansion.
Basal (A) and apical (B) surface views of a S10A mosaic egg chamber containing mys FC clones (GFP-negative) and expressing the cell membrane marker Resille-GFP, stained with anti-GFP. (C) Lateral view of a mosaic FE stained with anti-GFP (green) and Rodamine Phalloidin to detect F-actin (red). (D, E, F) Box plots of the basal surface (D), apical surface (E) and height (F) of control (green) and mys (grey) S10 FCs. (G) Box plot of the basal area of control (green) and mys (grey) FCs at different stages of oogenesis. (H). Box plot of the nuclear size of control (green) and mys (grey) S10 FCs. The statistical significance of differences was assessed with a t-test, *** P value < 0.0001. Scale bars, 10μm.

