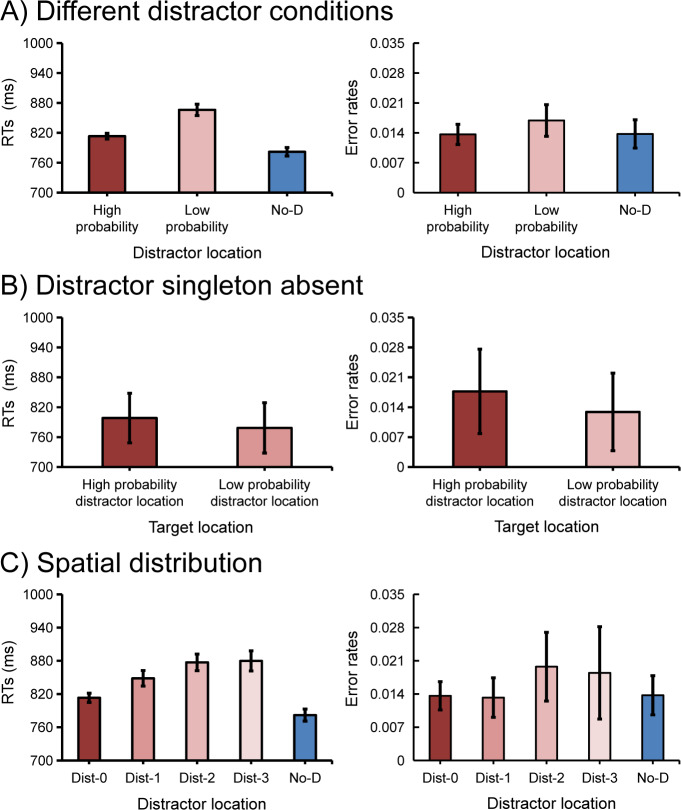
Fig 2. Results of search-only trials.
The mean response times (RTs) and mean error rates in different distractor conditions (A) and in the distractor singleton absent condition (B). The spatial distribution of attentional capture effect by the means of response times and error rates in the distractor singleton present condition (C). Here, Dist-0 represents the high-probability distractor location, Dist-1 represents the low-probability distractor location with 60° polar angle away from the high-probability distractor location (physical distance), and so on. Error bars denote 95% confidence intervals (CIs).

