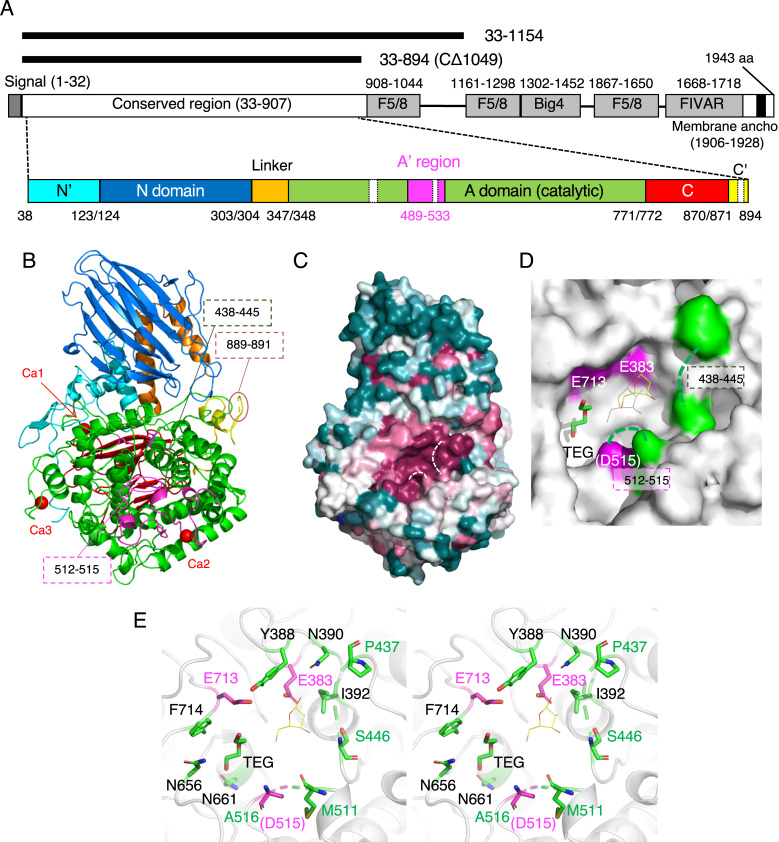
Fig 2. Structural architecture of HypBA2.
(A) Schematic representations of the full-length domain structure of HypBA2 are shown in the middle. Regions and domains modeled in the crystal structure are schematically shown below. Deletion constructs used for crystallography are shown above. (B) The overall structure of the CΔ1049 construct (residues 33–894) of HypBA2. (C) Sequence conservation mapping on the molecular surface. Amino acid sequence conservation among GH121 is colored with red (high), white (middle), and blue (low). (D) Molecular surface representation of the active site pocket in the catalytic domain. Glu383, Asp515, and Glu713 are conserved putative catalytic residues of GH121 (shown in magenta). Because Asp515 is disordered, the neighboring residue (Ala516) is shown. A triethylene glycol molecule (TEG) bound to HypBA2 and a β-L-Araf molecule bound to GH142 BT_1020 are shown as green sticks and thin yellow lines, respectively. (E) Stereoview of the active site of HypBA2. (A–E) Disordered regions are indicated with dotted lines.

