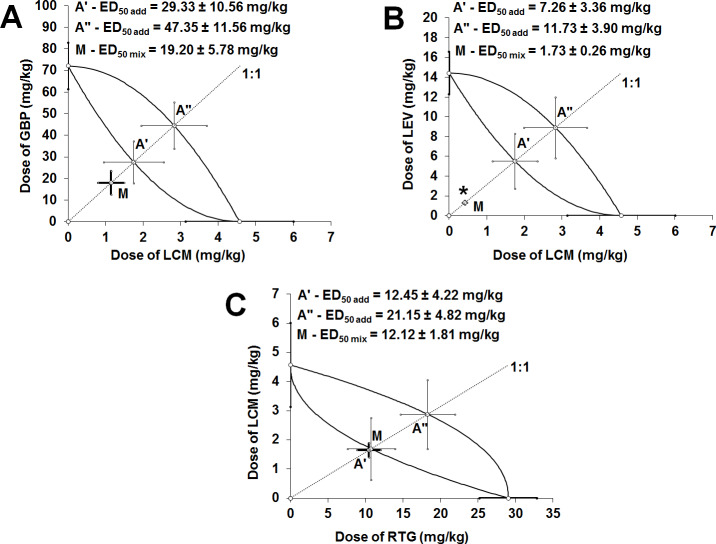
Fig 3. Isobolograms presenting interactions between gabapentin (GBP), lacosamide (LCM), levetiracetam (LEV), and retigabine (RTG), which had their dose-response relationship lines non-parallel, in the 6 Hz-corneal stimulation-induced seizure model in mice.
Isobolograms for various antiepileptic drugs combinations [GBP+LCM (A), LEV+LCM (B) and RTG+LCM (C)]. The ED50 of antiepileptic drugs when used alone (with S.E.M. as the error bars) are placed on the abscissa and ordinate of the Cartesian plot system. On each graph, the lines connecting the ED50 values on both, X and Y axes represent lower and upper lines of additivity with points A’ and A”, reflecting the ED50 add values (with S.E.M. as the error bars) for the two-drug mixture that theoretically exerts additive interaction for lower and upper lines, respectively. The point M illustrates the ED50 exp value (with S.E.M. as the error bars) for the two-drug combination that experimentally suppresses 6-Hz corneal stimulation-induced seizures in 50% of the animals tested. The dotted line crossing the points A’, A” and M illustrates the fixed drug dose ratio combination of 1:1. If the point M is placed significantly below the area of additivity (shaped by both, lower and upper lines of additivity), the observed interaction is synergistic (unpaired Student’s t-test). *P<0.05 vs. the respective ED50 add value. If the point M is placed close to the point A’, the interaction is additive in nature.

