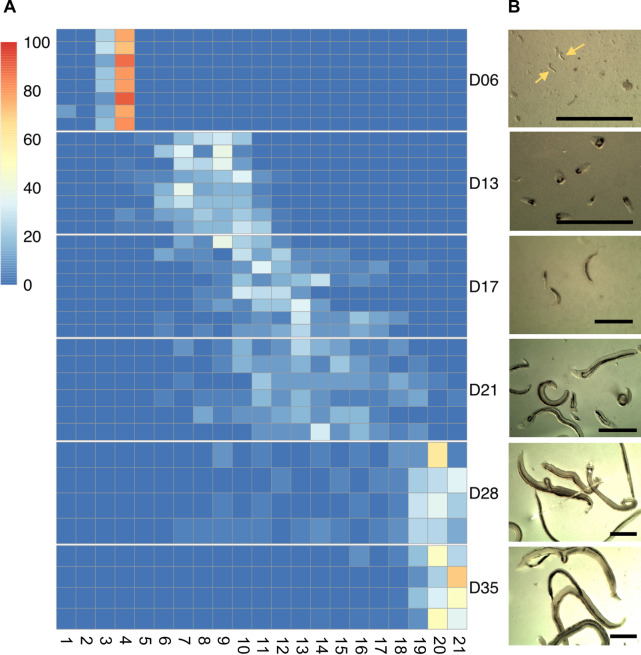
Fig 2. Morphology of in vivo S. mansoni.
A) Morphological scoring of S. mansoni parasites collected at the indicated time points post-infection (D06 to D35). Heatmap columns represent the twenty-one distinct morphological groups following published scores [22], and heatmap rows indicate biological replicates of the infections, i.e. parasites collected from individual mice. Colours on the heatmap show the number of worms that fell into each morphological group, normalised as a percentage of the total number of worms that were scored within the replicate. B) Representative images of worms from each time point. Scale bars: 1 mm.

