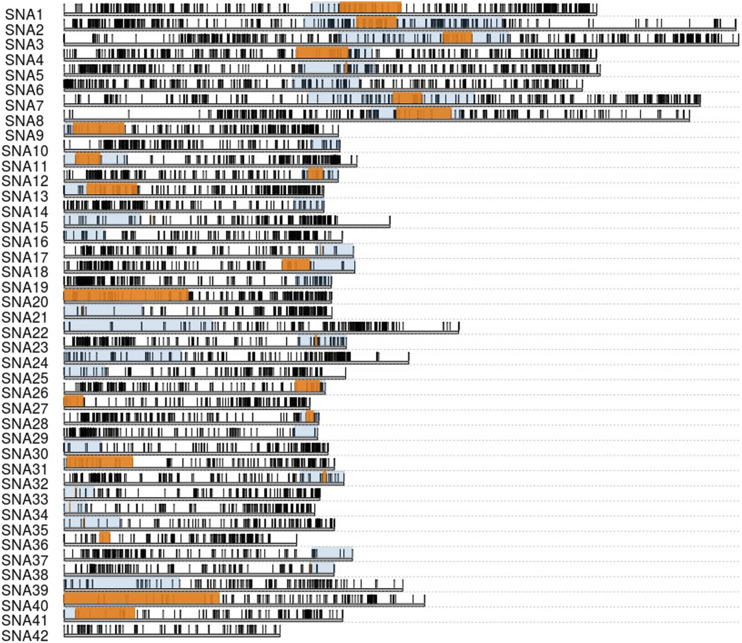
Figure 2.
Map Locations of 15,740 RAD loci along 42 lake trout linkage groups. Orange boxes highlight centromeres identified using half tetrad analysis with a y-threshold of 0.1. Blue boxes span the intervals of centromeres identified using the RFm method (Limborg et al. 2016) combined with half-tetrad analysis. Locations are in centimorgans on the female linkage map.

