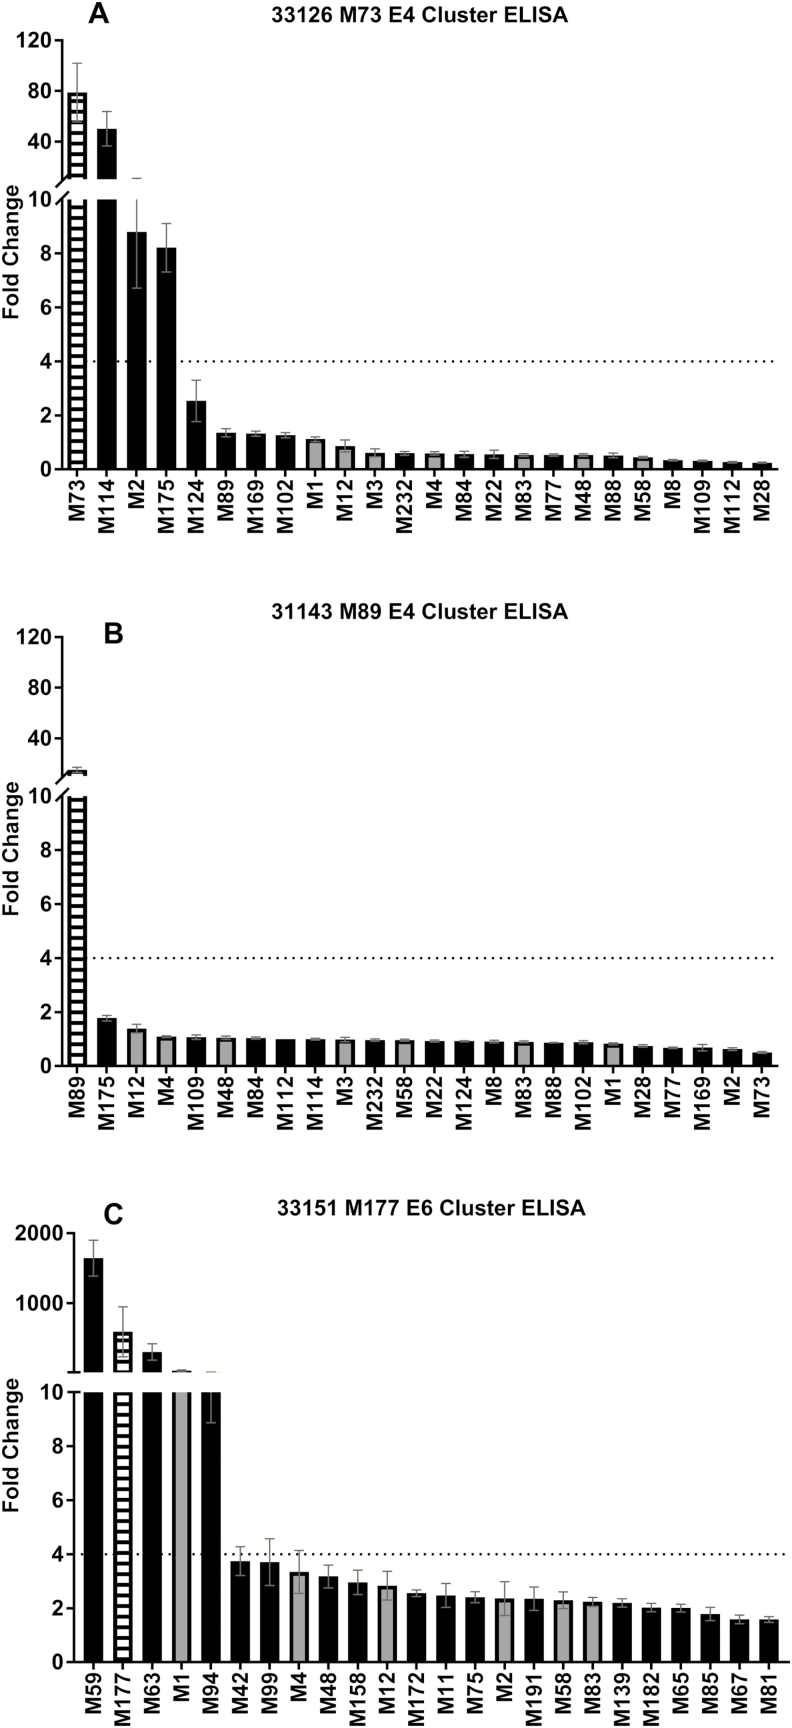
Figure 3.
Representative individual antibody responses toemm cluster–related and non-cluster-related M peptides. The average fold change between enzyme-linked immunosorbent assay (ELISA) titer from pre- and postinfection sera from 3 individual patients to N-terminal peptides from the M protein of the infecting group AStreptococcus (GAS) strain, allemm cluster–related GAS, and 7 non-cluster-related GAS strains. The figures represent the 3 different antibody response patterns observed: high response to infecting-type andemm cluster–related peptides (A), high response to infecting-type peptide only (B), and high response to infecting-type,emm cluster–related, and non-cluster-related peptides (C). Error bars represent the standard error of the mean.
White striped bars = infecting-type peptide; black bars =emm cluster–related peptide; gray bars = non-cluster-related peptide.

