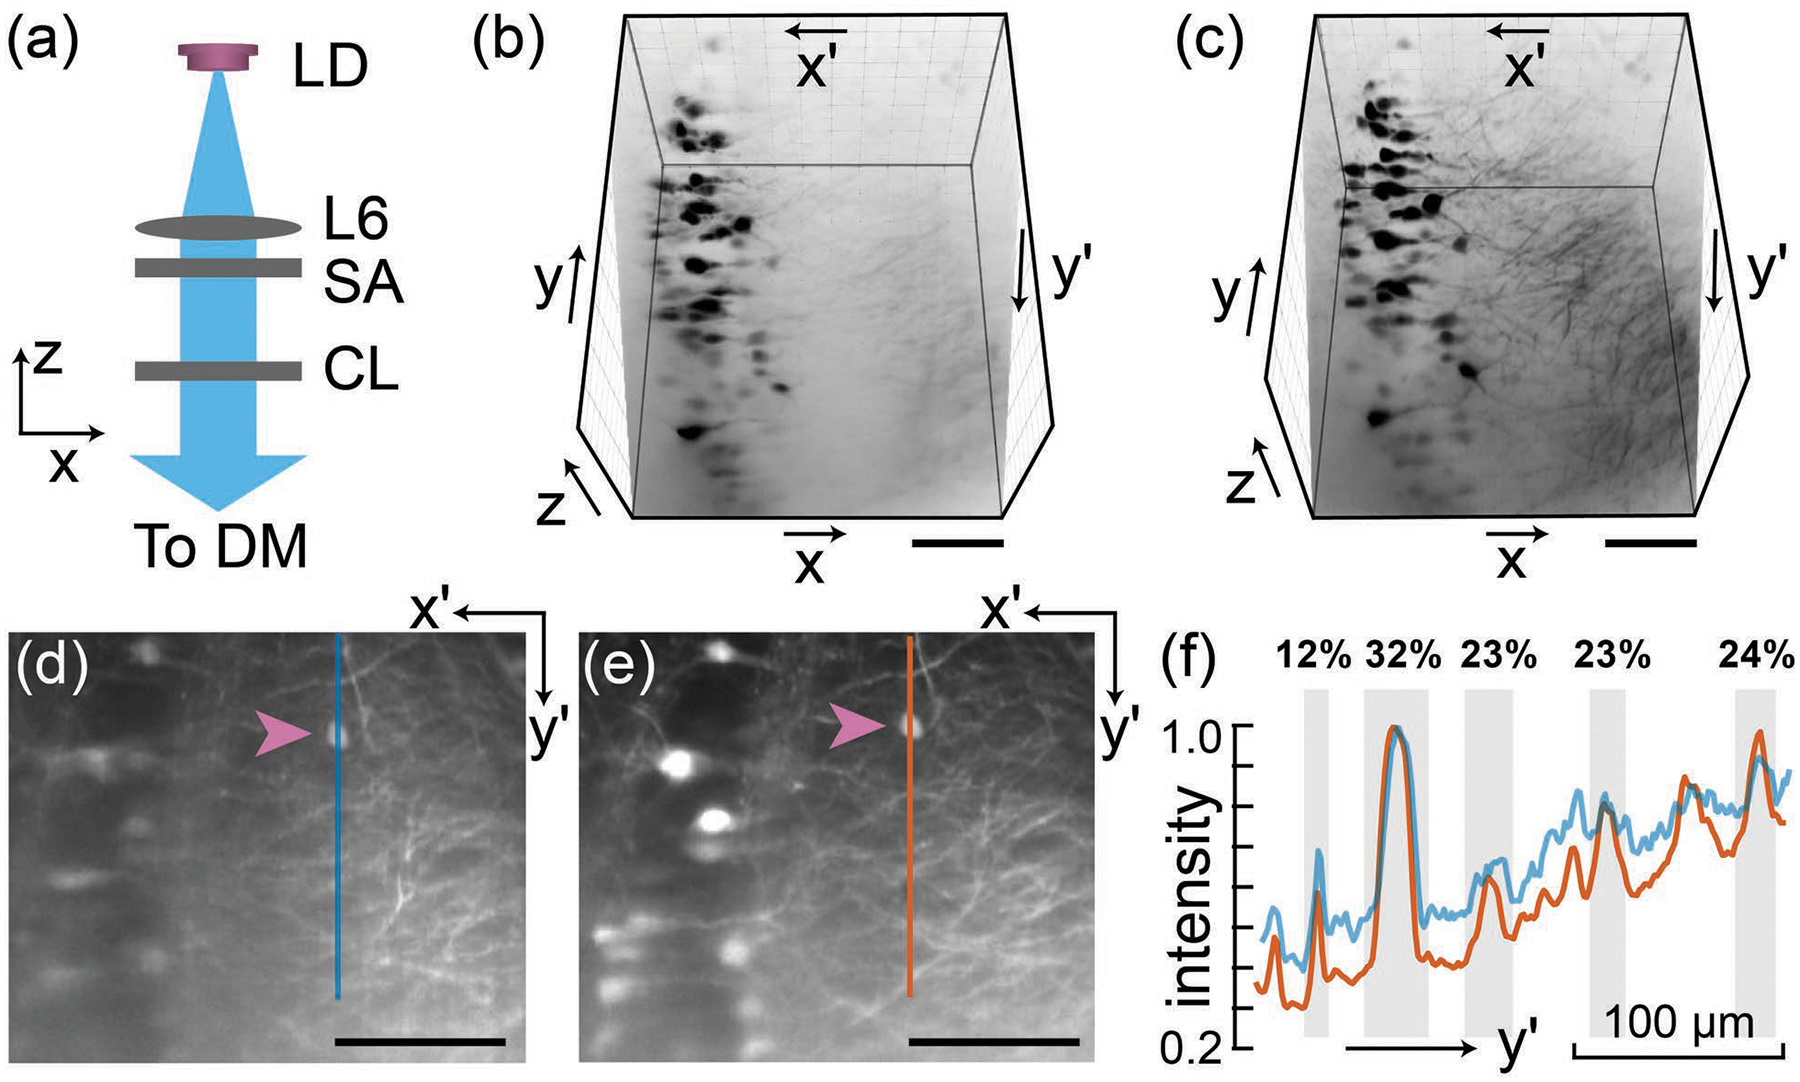
Figure 3.

Comparison of SOPi 1.0 and 2.0. (a) Light-sheet generation in the original SOPi 1.0. A 3D perspective view (inverted gray LUT) of the same scanned volume using SOPi 1.0 in (b) and SOPi 2.0 in (c). Also see Visualization 1. View of an oblique (x′y′) section of the sample using SOPi 1.0 in (d) and SOPi 2.0 in (e). The arrows point to the cell body used for normalizing the intensity plot shown in (f). Vertical line segments, corresponding to the intensity plots, are marked in (d) and (e). Features shaded in gray illustrate higher signal to background ratio across depth (% increase as noted). LD: laser diode, SA: slit aperture, CL: cylindrical lens, DM: dichroic mirror. (Scale bar: 100 μm)
