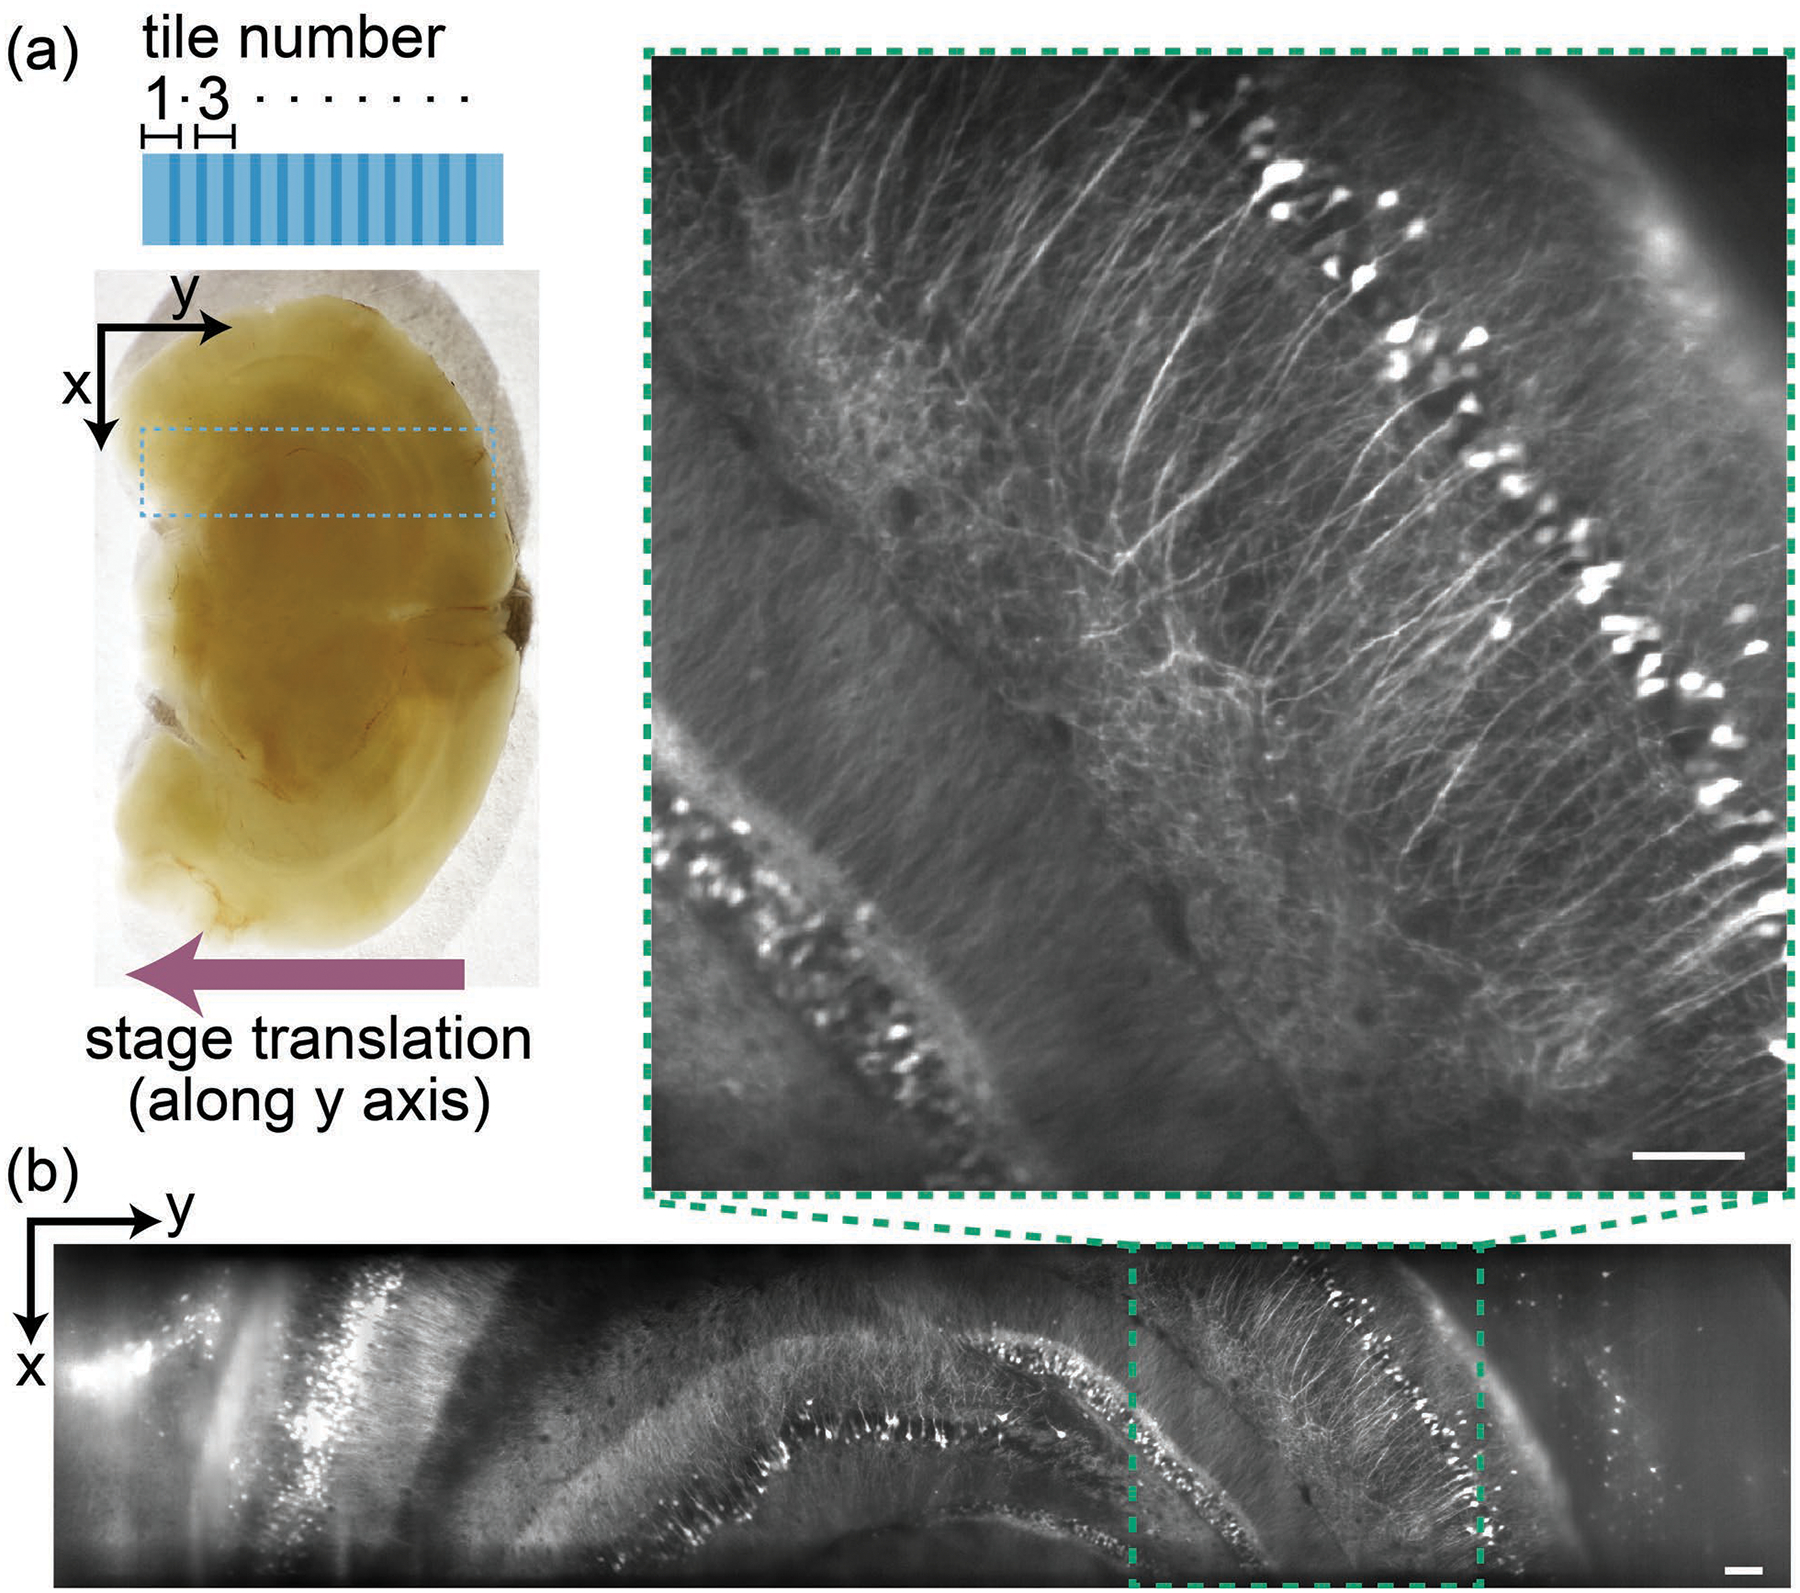
Figure 5.

Stitching multiple tiles along the y-axis. (a) Tile arrangement (top view) along a 1 mm thick, uncleared mouse brain section. Scanned region highlighted by the dashed rectangle. (b) A virtual slice from the stitched dataset, at the depth of 100 μm, along with the inset showing an enlarged view. Also see Visualization 3. (Scale bar: 100 μm)
