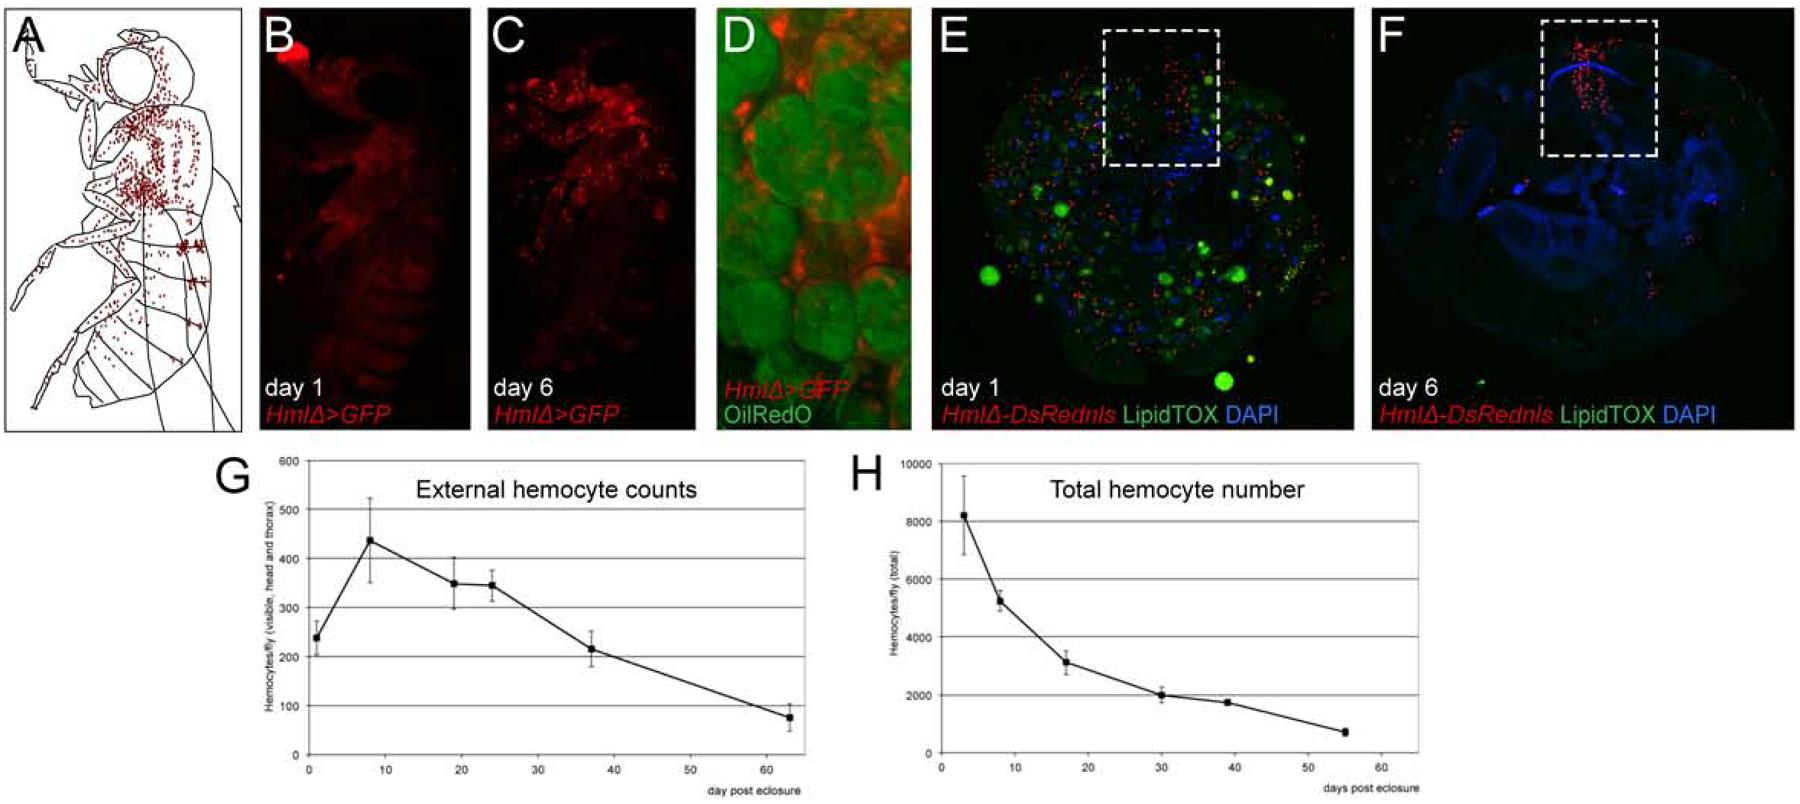
Figure 2. Developmental changes of hemocytes.

(A-C) Lateral view of adult Drosophila, (A) Model, hemocytes red, (B,C) HmlΔ-GAL4, UAS-GFP (hemocytes, red pseudo color), (B) day 1 post eclosure, (C) day 6 post eclosure. (D) Larval fat body cells (Oil Red O pseudo-colored green) with associated hemocytes (HmlΔ-GAL4, UAS-GFP pseudo-colored red), dissection of abdomen. (E, F) cross sections of anterior abdomen, HmlΔ-DsRednls (hemocytes red), LipidTox (green), DAPI (blue); dashed box marks heart region; (E) day 1 post eclosure; (F) day 6 post eclosure. (G) External hemocyte quantification of fluorescently labeled hemocytes, time course. (H) Total hemocyte counts per animal, time course.
