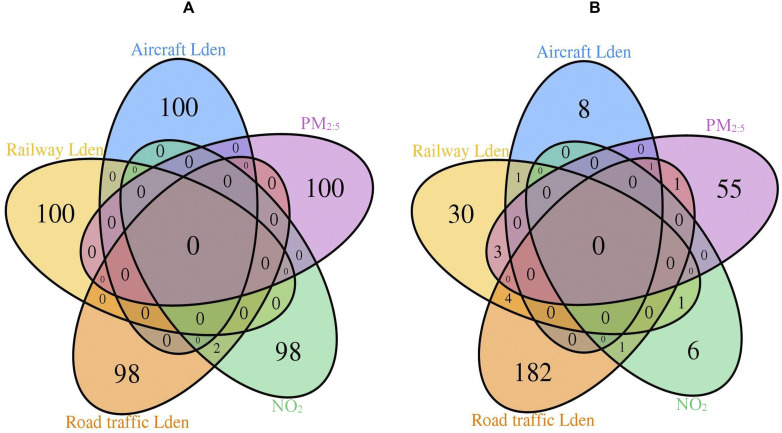
Figure 2.
Overlap of top 100 CpG signals (A) and genes annotated to significant differentially methylated regions (B) in relation to aircraft, railway, and road traffic Lden, , and identified from multiexposure EWAS in the SAPALDIA study. Note: EWAS, epigenome-wide association study; Lden, day-evening-night noise level; , nitrogen dioxide; , particulate matter in diameter; SAPALDIA, Swiss Cohort Study on Air Pollution and Lung and Heart Diseases in Adults. CpGs were identified by multiexposure EWAS using multivariable linear mixed-effects models with random intercepts at the level of participants, and adjusted for age, sex, educational level, area, neighborhood socioeconomic status, greenness index, smoking status, smoking pack-years, exposure to passive smoke, consumption of fruits, vegetables and alcohol, nested study, asthma status, noise truncation indicators, survey and leukocyte composition. In a preliminary step, DNA methylation -values were regressed on the Illumina control probe-derived first 30 principal components to correct for correlation structures and technical bias, and residuals of these regressions covering 430,477 CpGs were used as the technical bias-corrected methylation level at the CpG sites. Extreme values of the residuals (lying beyond three times the interquartile range below the first quartile and above the third quartile at each CpG site) were replaced with their corresponding detection threshold value (“modified winsorization”). The “winsorized” data were then used as the dependent variables in the present EWAS. CpGs (annotated gene) intersecting at the level of road traffic Lden and were cg12439232 and cg15590912 (CCSAP). Genes (DMR) intersecting at the level of road traffic Lden and was PRRT1 (chr6:32,115,964–32,117,401); and at the level of aircraft and road traffic Lden and was HOXA2 (chr7:27,141,774–27,143,806). VTRNA2-1 (chr5:135,415,129–135,416,613) intersected between aircraft and railway Lden, ZFP57 (chr6:29,648,161–29,649,084), between railway Lden and , and ZSCAN31 (chr6:28,303,923–28,304,451), between road traffic Lden and . TRIM39, TRIM39-RPP21, and HCG18 (chr6:30,296,689–30,297,941) intersected between railway Lden and , whereas SLC27A3 (chr1:153,746,588–153,747,856), B3GALT4 (chr6:33,244,976–33,246,185), EN2, and AC008060.8 (chr7:155,249,398–155,251,925) intersected between railway and road traffic Lden.

