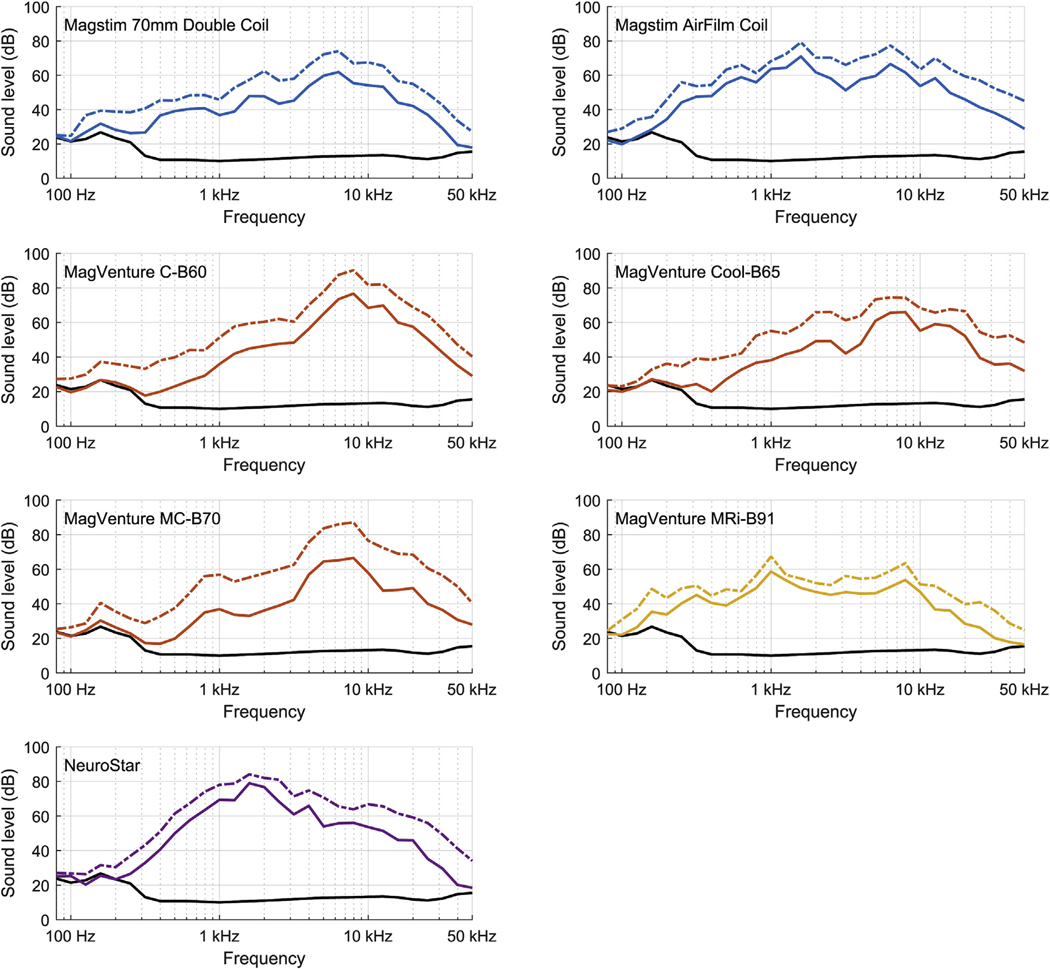
Fig. 2.
1/3-octave spectra of tested coils at estimated 100% RMT (solid line) and at 100% MSO (dash-dotted line). Solid black line shows ambient sound spectrum. The spectra below 300 Hz are affected by the acoustics of the soundproof chamber (for more detail, see Supplementary material). For all coils, spectra power peak is between 1000 and 10,000 Hz, i.e.,within hearing range (20e20,000 Hz). Spectra at 100% RMT were produced from closest measured stimulator output by assuming that sound waveform is proportional to pulse energy. Due to the 0.2 s time window for each sample, the sound level corresponds to that of a 5 Hz rTMS pulse train.

