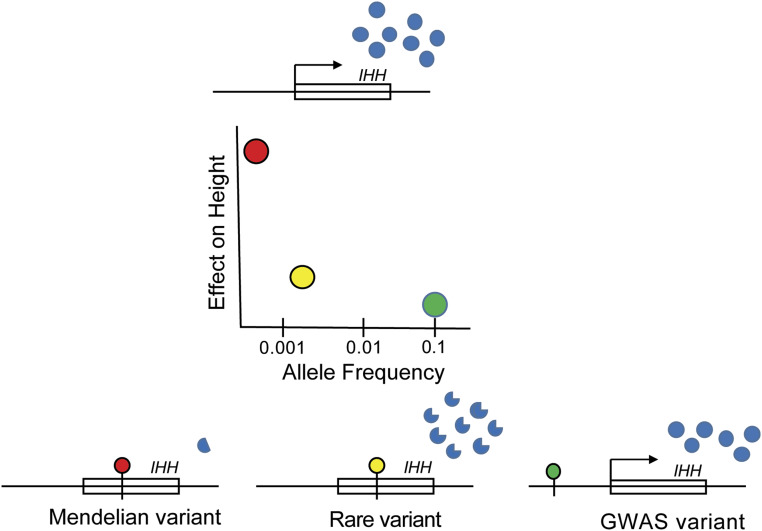
Figure 2.
A spectrum of genetic variation atIHH influences height. On the top is theIHH gene, which produces abundant amounts of normally functioning protein (blue dots). The plot in the middle shows the relationship between frequency of variants and effects on height. The red dot in the plot shows an extremely rare variant that causes acrocapitofemoral dysplasia and leads to a 2.3- to 8.6-SD reduction in height. As shown on the bottom left, this mutation leads to a truncated protein with very low expression. The yellow dot in the plot shows a rare variant detected in the rare variant GWAS that has a frequency of approximately 0.2% and causes a 0.294-SD reduction in height. As shown in the bottom middle, this variant alters the protein sequence ofIHH and results in a protein with slightly different functional properties. The green dot in the plot shows a common GWAS variant with frequency of 10%, which leads to a 0.041-SD reduction in height. As shown on the bottom right, this variant is in a regulatory region (not within theIHH gene itself) and influences expression ofIHH.

