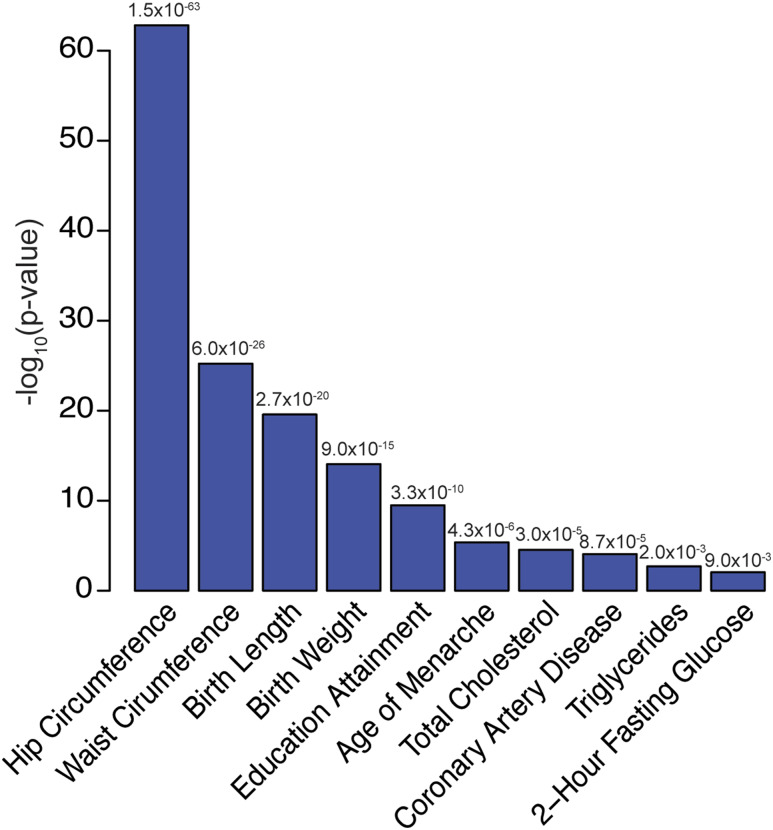
Figure 3.
Cross-trait genetic correlations between adult height and selected (allP < 0.001) additional traits and diseases. GWAS data from Lango Allenet al. (19) used for height. They-axis shows the –log10(p-value) for each correlation. All results downloaded from LD Hub (http://ldsc.broadinstitute.org/).

