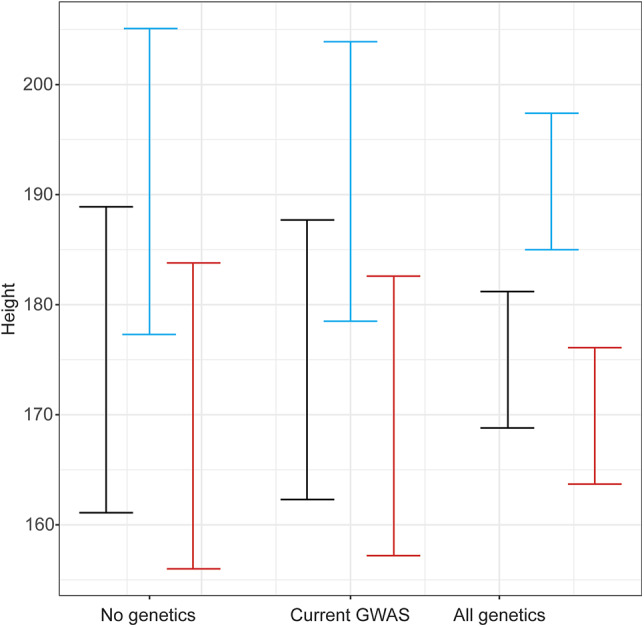
Figure 4.

Efficacy of genetic data for the prediction of height. Displayed are the width of the 95% CI for height predictions if no genetics are taken into account, all current GWAS-associated variants (combining to explain 17% of variation) are used, or in an ideal setting where all of variants that influence height are known (combining to explain 80% of variation) and used to predict height. Calculations are based on an average height of 177 cm with an SD of 7.1 cm for men of European ancestry. The black bars are for an individual with an average predicted height (177 cm). The blue bars are for an individual whose predicted height is 2 SDs above the mean (191.2 cm). The red bars are for an individual whose predicted height is 1 SD below the mean (169.9 cm).
