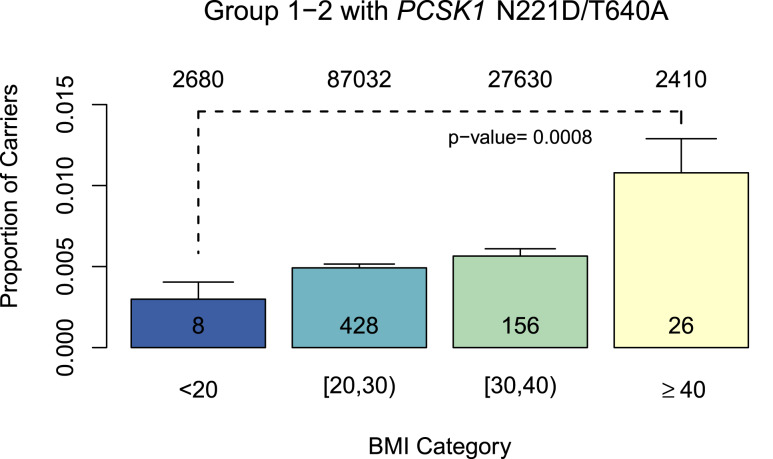
Figure 5.
The proportion of individuals in the UK Biobank carrying two or more group 1 and 2 variants (plusPCSK1 N221D and T640A) across the three genes for BMI category (comparison of BMI <20, 20–30, 30–40, and ≥40 kg/m2). For groups 1 and 2, the carrier frequency tends to increase as BMI increases, and there is a significant difference in the carrier frequencies between the BMI <20 and BMI >40 groups (error bars represent 95% CIs). Analyzing group 1 data only did not reveal a significant difference between the groups, because of the low numbers or absence of group 1 homozygotes, heterozygotes, or composites in the BMI <20 kg/m2 and BMI >40 kg/m2 groups. The total number of noncarriers (top) and carriers (bottom) for each BMI category are shown in the columns.

