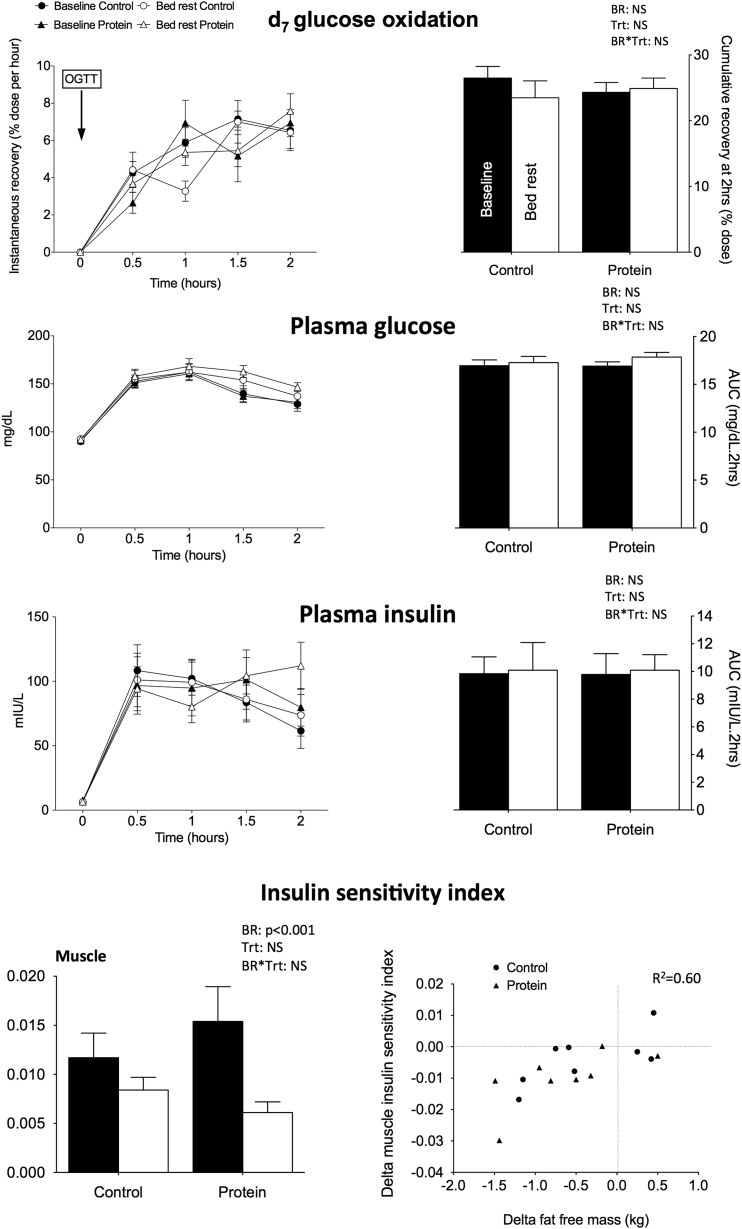
Figure 1.
Glucose tolerance after OGTT. Mean kinetics of d7 glucose oxidation and plasma insulin and glucose of the 9 participants are presented for control and protein treatment at baseline and after 21 days of bed rest after an OGTT at 75 mg. AUCs are presented on the right side of the figure. OGTT-derived muscle insulin sensitivity index derived from plasma insulin and glucose is presented as calculated from Abdul-Ghaniet al. (21) at the right bottom of the figure. Data are means ± SEM. Statistical analyses were performed with a linear mixed effects model adjusted for period effect and controlled for repeated measures. Results are presented asP values for bed rest (BR), treatment (Trt), and BR*Trt effects.P < 0.05 is considered significant. The relationship between delta insulin sensitivity index and delta FFM is presented at the left bottom of the figure. NS, nonsignificant.

