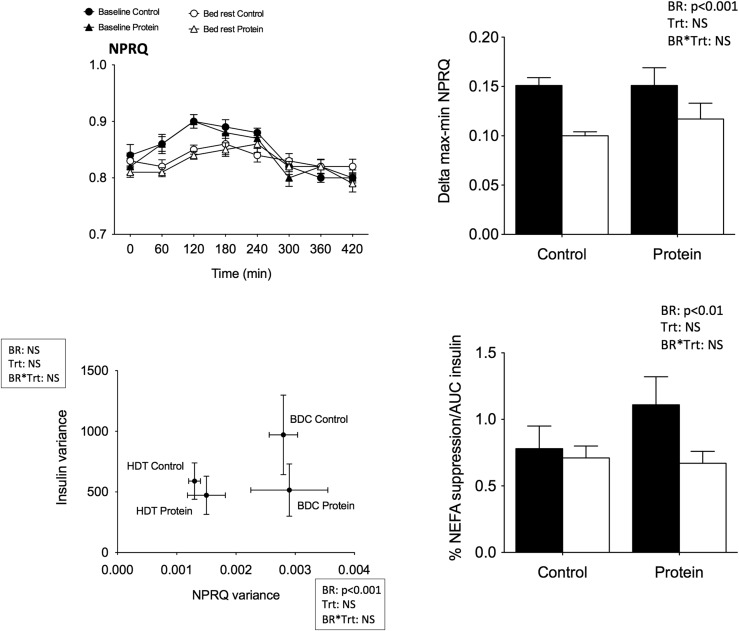
Figure 4.
MF after lipid challenge. Upper left: Mean NPRQ kinetics over the 7 hours after ingestion of fat meal. Upper right: Mean delta max–min of NPRQ values. Lower left: Mean insulin variance values as a function of mean NPRQ variance calculated over the 7 hours after the meal. Lower right: Percentage NEFA suppression normalized by AUC insulin. Each graph represents the values from the 9 participants in the control and protein treatments at baseline (black) and after bed rest (white). Data are means ± SEM. Statistical analyses were performed with a linear mixed effects model adjusted for period effect and controlling for repeated measures. Results are presented asP values for bed rest (BR), treatment (Trt), and BR*Trt effects.P < 0.05 is considered significant. BDC, baseline data collection; HDT, head-down tilt bed rest; NS, nonsignificant.

