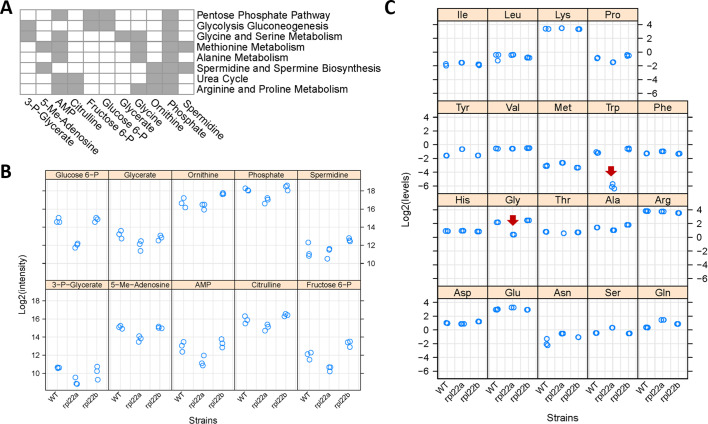
Figure 6. Metabolic profiling indicates reduced flux through central metabolic pathways and the folate cycle in rpl22aΔ cells.
(A) Eleven metabolites shown at the bottom had significantly reduced levels in rpl22aΔ cells (Log2FC ≥ 1, p<0.05; based on bootstrapped ANOVA; see Materials and methods) and they were significantly enriched for the metabolic pathways shown to the right (FDR < 0.05). Pathway enrichment analysis was done with the MetaboAnalyst R language package. The metabolites were identified with untargeted, MS-based profiling of primary metabolites and biogenic amines, and targeted amino acid analysis. Metabolites indicated with gray in the Table are part of the pathways shown to the right. (B) The Log2-transformed peak intensities from the MS-based profiling of the metabolites shown in A (except Glycine) are on the y-axis. The strains used in the analysis are on the x-axis. (C) The Log2-transformed levels (in nmoles) of amino acids, after PTH-derivatization, Edman degradation and HPLC detection, are shown on the y-axis. The red arrows indicate the only amino acids (Gly and Trp) whose levels were significantly lower in rpl22aΔ cells (Log2FC ≥ 1, p<0.05; based on bootstrapped ANOVA; see Materials and Methods). The strains used in the analysis are on the x-axis, and they were in the BY4742 background.


