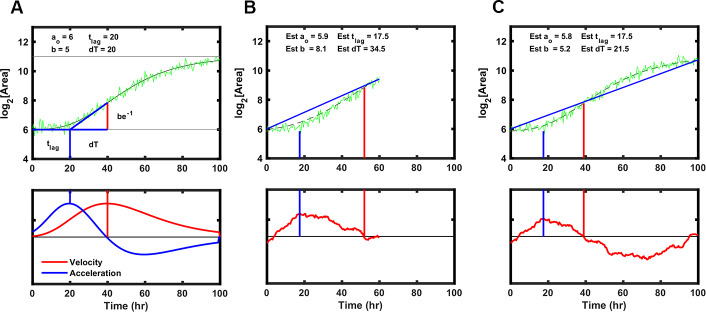
Figure 11. Strategy to fit Gompertz function parameters on a simulated growth curve with noise added.
(A) Illustration of the parameters used to fit the Gompertz function as described in Materials and methods. Note the value dT, the time between T-Lag and the maximum growth velocity, is used for estimating the growth curve but T-Exp is reported. T-Exp is the time between the maximum and minimum acceleration or twice the value dT. (B) Initial estimates of each parameter were generated from a line connecting the first and last data points in a truncated simulated growth curve, which represents the time of experimental data acquisition. Bottom panel shows the differences between the line generated and the simulation. The initial estimate for T-Lag is determined by the maximum difference between the line generated and the simulation (blue vertical lines). T-Exp (or 2× dT) is determined where the absolute difference between the line and the simulated data is minimized (red vertical line). (C) Same as B with longer simulation time, showing initial estimates are similar.

