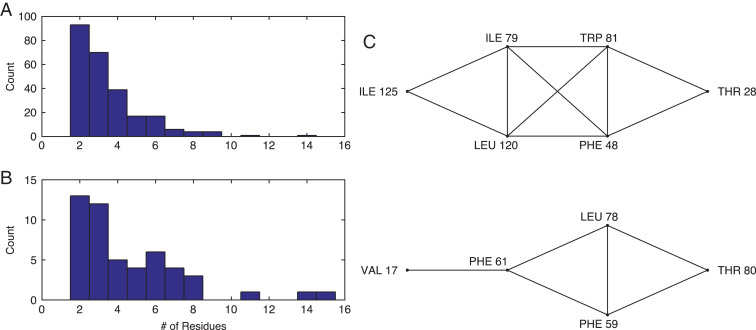
Fig. 3.
The distribution of cluster sizes in the (A) Dunbrack 1.0 Å and (B) HiQ54 databases. Each cluster is defined as a set of residues in a protein core that interact with each other, but not with any other side chains of other core residues. (C) Examples of interaction networks based on two clusters of core residues from protein PDB:1T3Y. The clusters contain eight (top) and five (bottom) residues, respectively. Each line in the network indicates interactions between two residues. For example, in the top cluster Ile 125 interacts with Ile 79 and Leu 120, but does not interact with Trp 81 or Val 17 (in another cluster).

