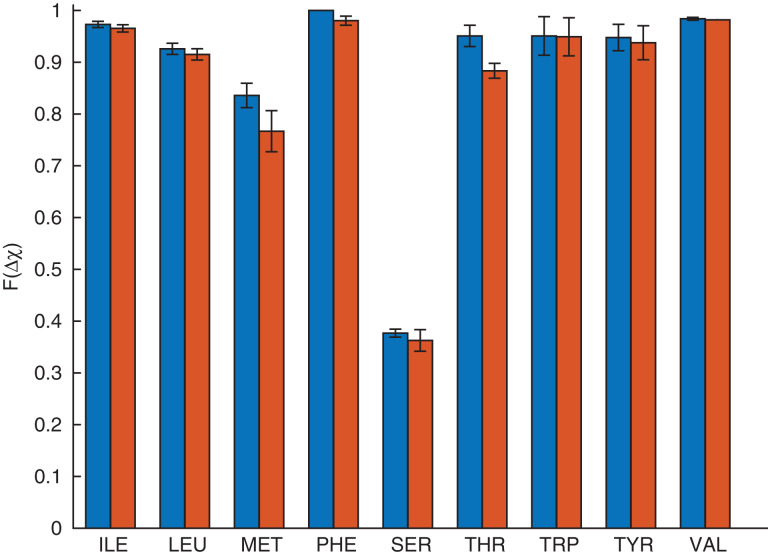
Fig. 6.
Comparison of the accuracy of single and combined rotations for core residues in the Dunbrack 1.0 Å database. Each bar shows the fraction of residues for which the hard-sphere model prediction of the side chain conformation is Δχ < 30° for single (blue, left bar) or combined (red, right bar) rotations.

