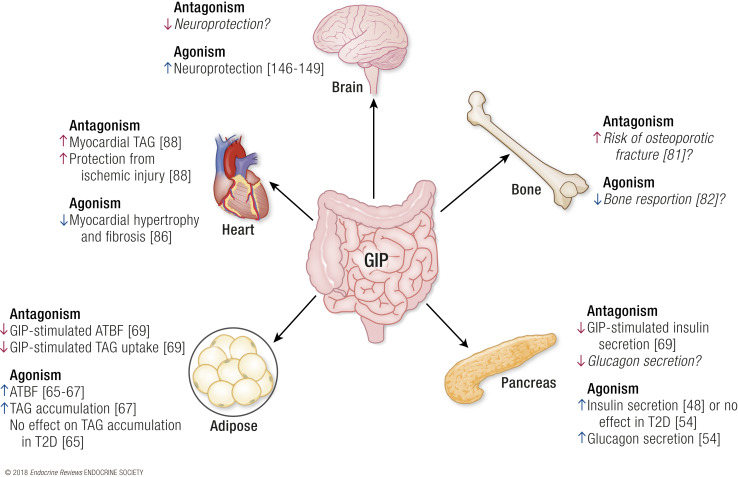
Figure 2.
Proposed activities of GIPR antagonism vs agonism. The projected activities of a GIPR antagonist at each tissue with GIPR expression is shown in red, and agonism is shown in blue. References supporting these activities are provided in brackets. Italicized text indicates a presumed effect of agonism or antagonism but does not have data to support a known activity. ATBF, adipose tissue blood flow; TAG, triacylglycerol.

