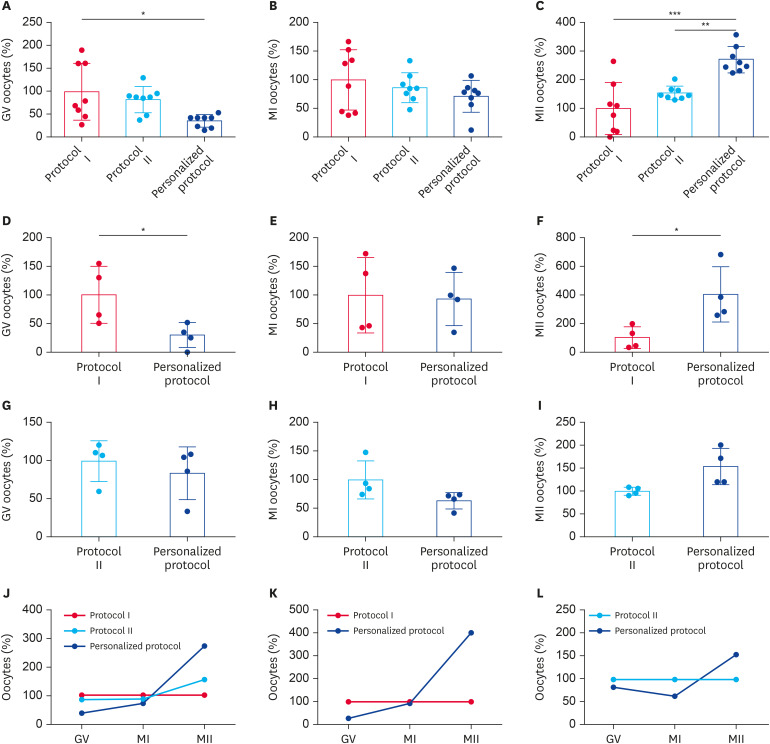
Fig. 4. (A-C) The proportions of GV-stage, MI and MII-stage oocytes after ovulation induction by three protocols. (A) The proportion of GV-stage oocytes from the personalized superovulation protocol were 15.0% ± 5.6%, less than from superovulation protocol I (41.3% ± 25.5%). (B) The proportions of MI-stage oocytes after ovulation induction by three protocols were not different. (C) The proportion of MII-stage oocytes retrieved from the personalized superovulation protocol was 58.5% ± 9.9%, highly significantly greater than the 21.5% ± 19.6% from superovulation protocol I and obvious greater than the 33.2% ± 5.1% from superovulation protocol II. (D-F) Results of the same monkey (#1, 2, 3, and 6) stimulating with superovulation protocol I and the personalized superovulation protocol. (D) The proportion of GV-stage oocytes between the first ovulation induction using superovulation protocol I and the second induction using the personalized superovulation protocol was different (51.0% ± 25.9% vs. 14.6% ± 11.4%). (E) There was no difference in the proportion of MI-stage oocytes. (F) There was difference in the proportion of MII-stage oocytes (12.8% ± 9.9% vs. 51.5% ± 24.9%). (G-I) Results of the same monkey (#9, 13, 14, and 16) stimulating with superovulation protocol II and the personalized superovulation protocol. The proportions of GV, MI and MII–stage oocytes obtained from the first ovulation induction using the superovulation protocol II and the second ovulation induction using the personalized superovulation protocol were not different. (J-L) Oocyte progression within the ovary from the GV-stage to the MI and MII-stages by three protocols. The proportion of MII-stage oocytes from the personalized superovulation protocol relative to the superovulation protocols I and the superovulation protocol II showed a tendency to increase.
GV-stage oocytes, immature oocytes at the germinal vesicle; MI-stage oocytes, immature oocytes at the metaphase I status; MII-stage oocytes, mature oocytes at the metaphase II status.
*p ≤ 0.05, **p ≤ 0.01, ***p ≤ 0.001.

