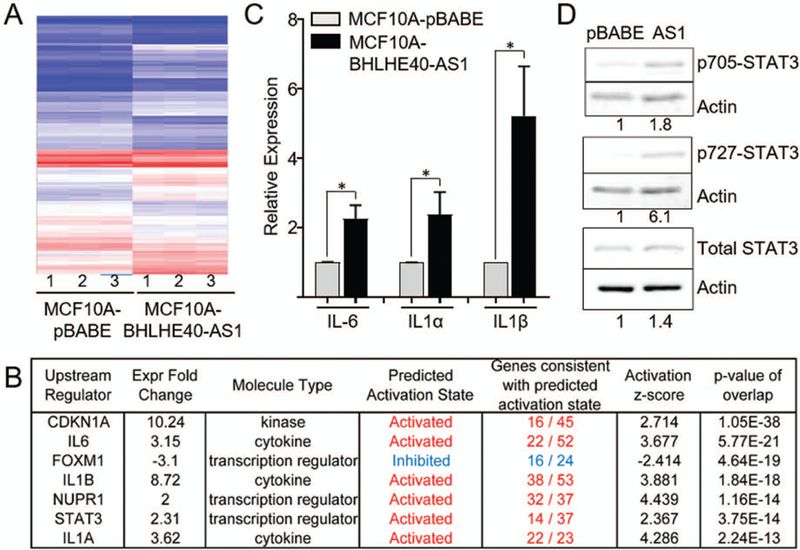
Figure 5. BHLHE40-AS1 expression induces cytokine signature.

Panel A: 2.0x10⁵ MCF10A-pBABE and MCF10A-BHLHE40-AS1 cells were plated in 6 well dishes. Total RNA was collected 48h after plating. 100ng RNA from three biological replicates were assessed via Clariom™ D Array and analyzed by the Transcriptome Analysis Console (TAC) software. Panel B: Ingenuity Pathway Analysis identified upstream signaling regulators in the MCF10A overexpression cell line. Upstream regulators were filtered for expression fold change of ±2, ordered by p-value of overlap. Panel C: Expression of indicated cytokines was determined by qRT-PCR from 48h total RNA cell extracts. Bars represent mean ± SD from 3 biological replicates. * p<0.05, two-tailed Student’s t test. Panel D: MCF10A-pBABE and MCF10A-BHLHE40-AS1 cells were immunoblotted with indicated antibodies. Densitometry was performed in ImageJ.
