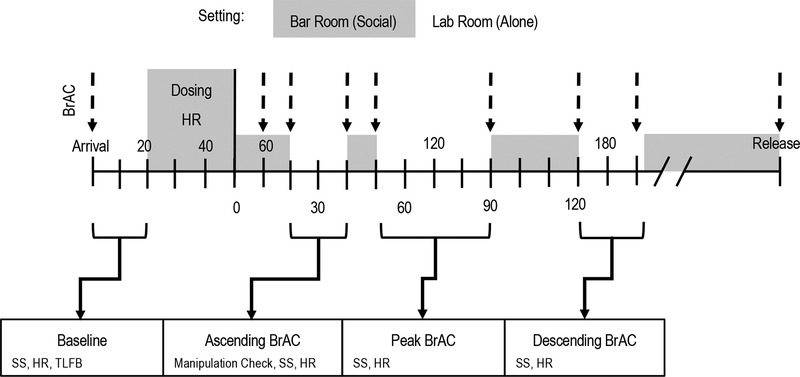
Figure 1.
Timeline of within-session events. “Arrival” indicates completion of certain procedures in the lab hallway lobby area (e.g., consent form, height and weight measurement). Shading indicates times after “arrival” when each participant was in the simulated bar room alongside other participants or confederates. Lack of shading indicates times after “arrival” when each participant was alone in the standard lab room. Breath alcohol concentration (BrAC) was measured approximately every 10 min. BrAC measurements are represented using dashed lines with an arrowhead. Targets for ascending, peak, and descending BrAC assessments were 0.06 g%, 0.08 g%, and 0.06 g%, respectively. Subjective stimulation (SS) was measured using the High Arousal Positive Valence subscale of the Subjective Effects of Alcohol Scale (Morean, Corbin, & Treat, 2013). Heart rate (HR) was measured in beats per minute (bpm). HR in the lab room was measured over 5 min. HR in bar room was measured over 30 min. Recent alcohol use was assessed at baseline using an assisted timeline followback (TLFB) procedure (Sobell & Sobell, 1992). The manipulation check item asked participants to estimate the number of standard drink equivalents they consumed in the simulated bar room. Numbers above the number line indicate time since arrival in minutes. Numbers below the number line indicate time after dosing in minutes.

