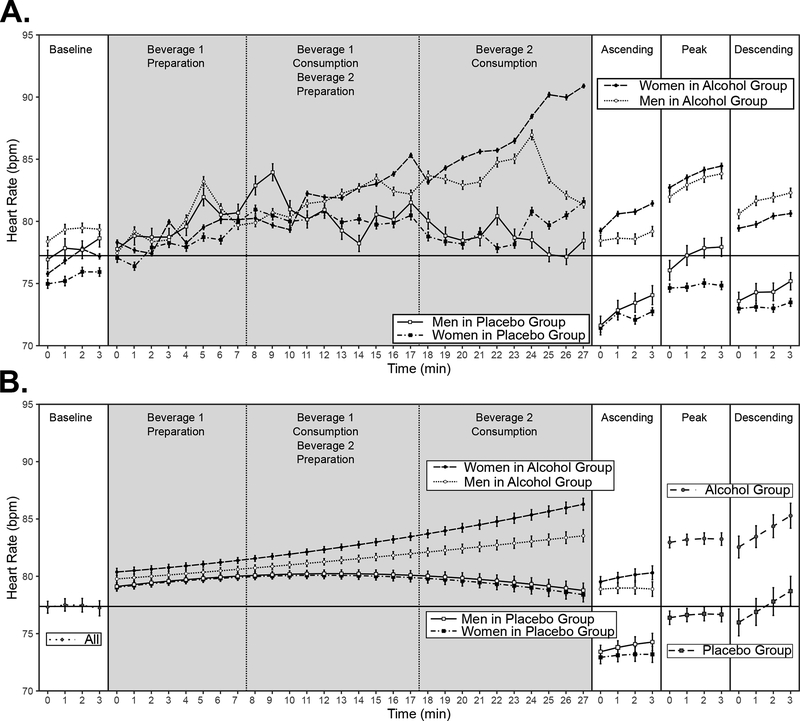
Figure 3.
Heart rate (HR) across experiment phases. A-B: Horizontal line represents the average Baseline HR across Group and Sex. Solid vertical lines indicate boundaries of each experiment phase. Dashed vertical lines indicate boundaries between events of interest inside the dosing phase. Gray plot area indicates participants were in the bar room (social). White plot area indicates participants were in the lab room (alone). A: Sample mean and standard error for each experiment phase. B: Means and standard errors for each experiment phase estimated from the best statistical model. Best model for baseline phase did not include Group or Sex effects. Best models for dosing and ascending phases included both Group and Sex effects. Best models for peak and descending phases included Group effects, but not Sex effects. Means and standard errors for dosing, ascending, peak, and descending phases are estimated while controlling for between-person differences in Baseline HR.

