
Fig. 4: Effects of OLZ and HFD on expression of key genes involved in lipid and glucose metabolism.
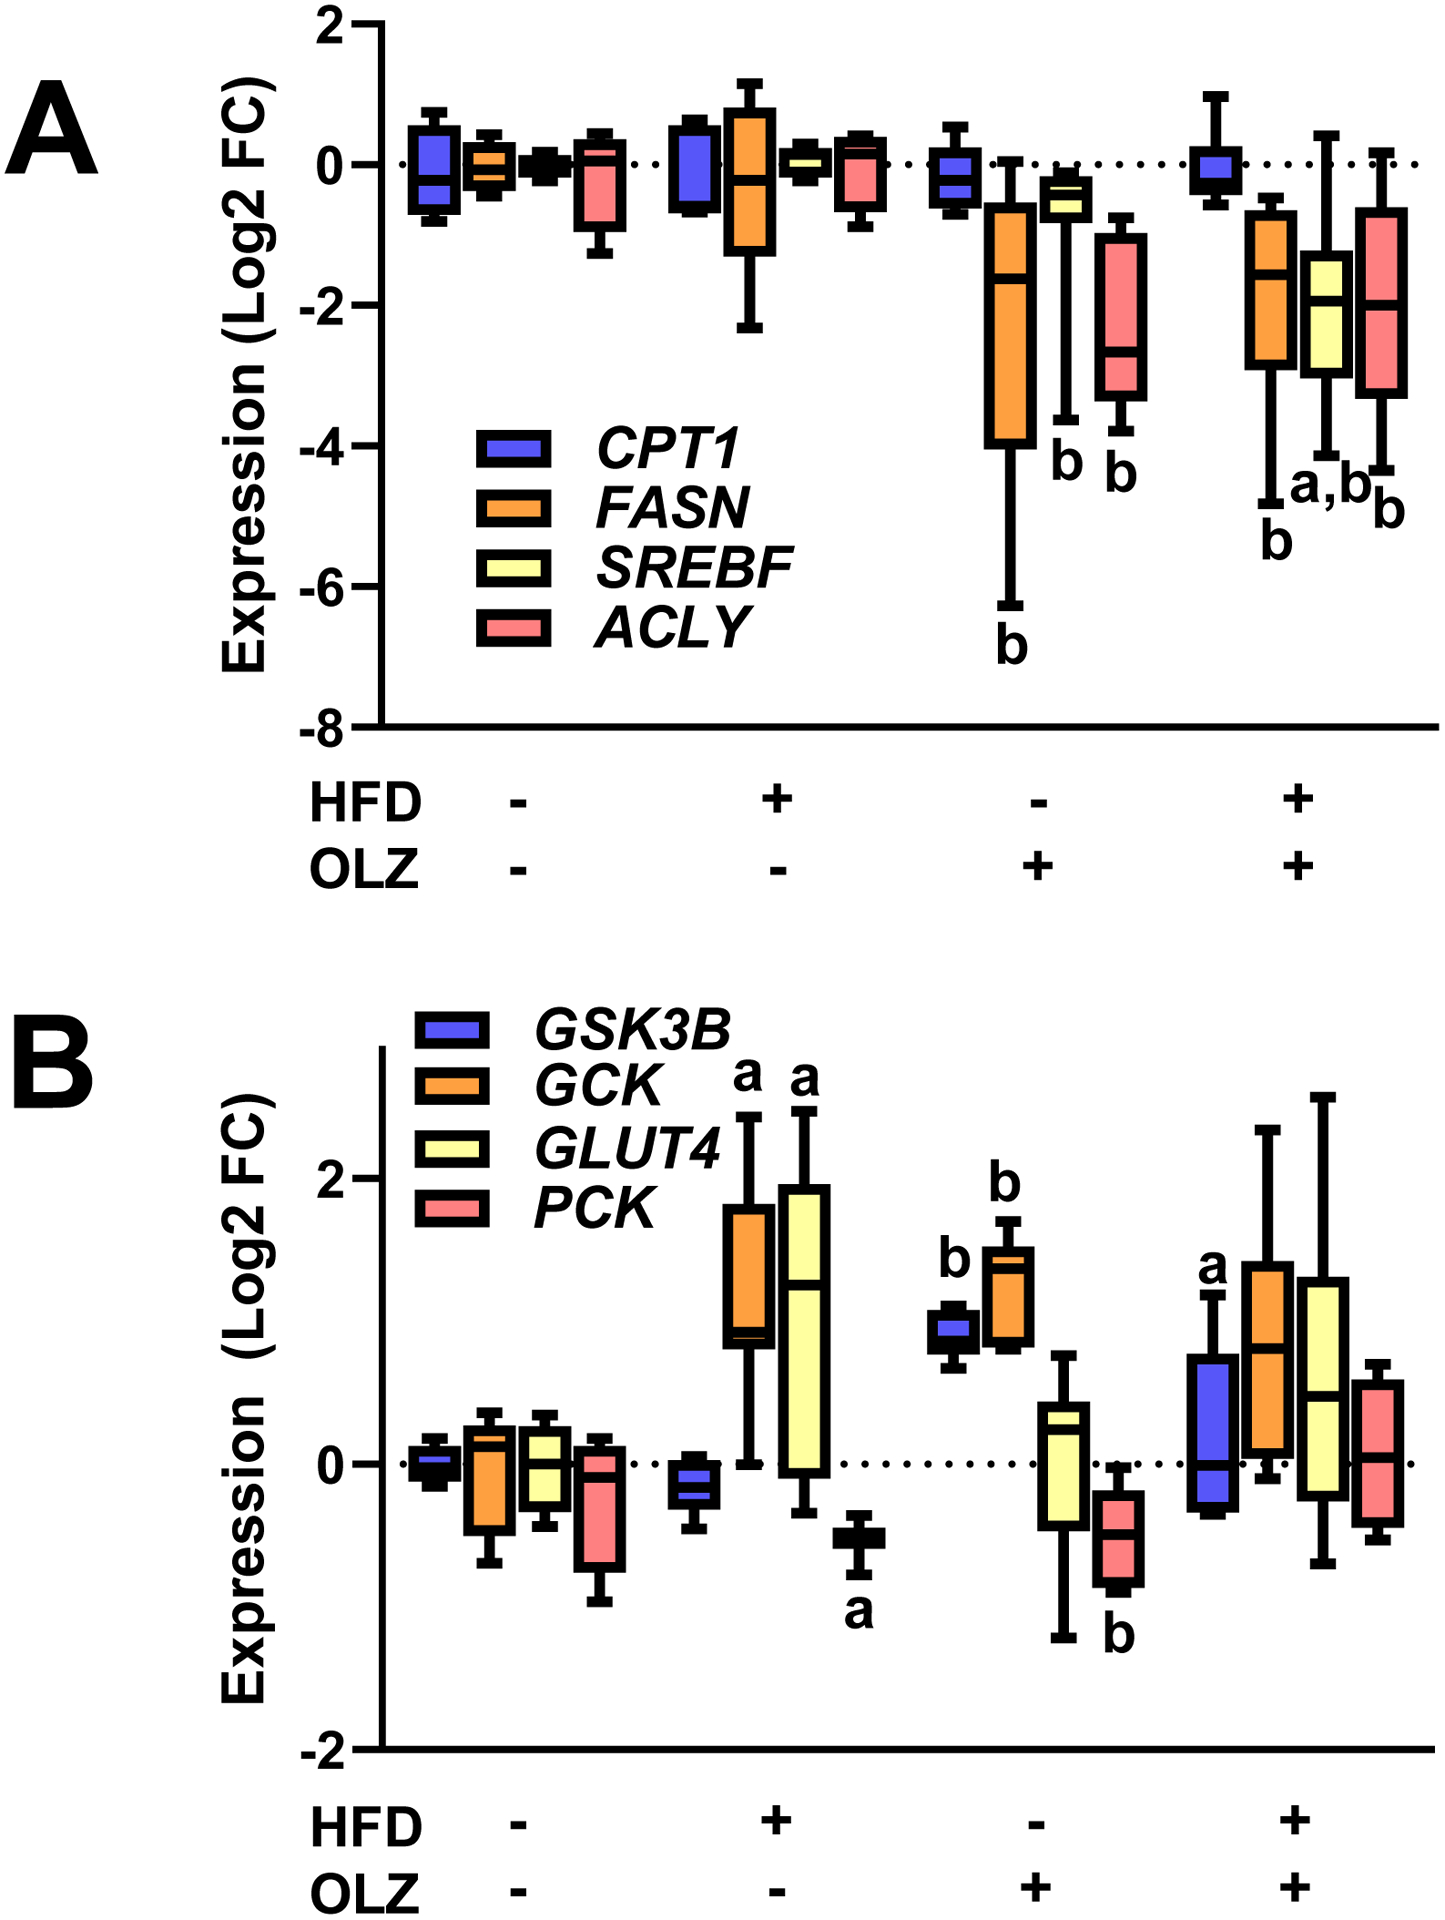
Expression of key genes involved in de novo lipid genesis and catabolism (Panel A) and glucose metabolism (Panel B) were determined by real-time rtPCR. aP <0.05 compared to LFD; bP <0.05 compared to absence of OLZ by 2-way ANOVA with Tukey’s post-hoc analysis.