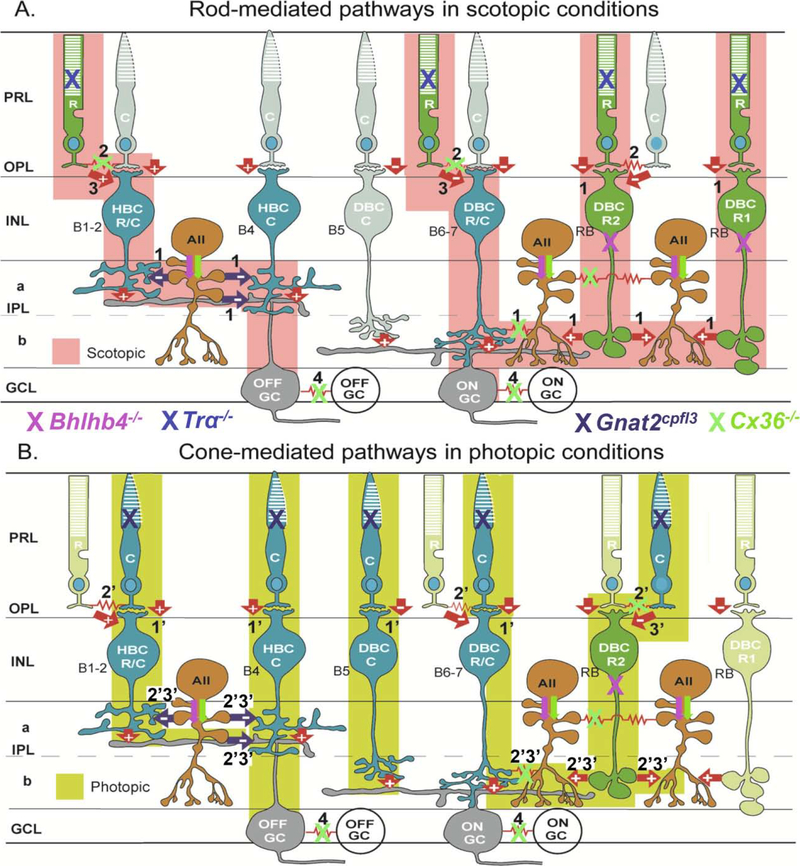
Figure 1. Schematic diagram of major synaptic pathways mediating light responses of mouse ON and OFF ganglion cells in scotopic (A) and photopic (B) conditions.
R: rod, C: cone, HBCR/MC: Mixed rod/M-cone hyperpolarizing bipolar cell; HBCMC: M-cone hyperpolarizing bipolar cell; DBCMC: M-cone depolarizing bipolar cell, DBCR/MC: Mixed rod/M-cone depolarizing bipolar cell; DBCR2: type 2 rod depolarizing bipolar cell; DBCR1: type 1 rod depolarizing bipolar cell; AII: AII amacrine cell; OFFGC: OFF ganglion cell; ONGC: ON ganglion cell; green: rods and rod BCs; blue: cones and cone BCs, dark orange: ACs; grey: GCs; arrows: chemical synapses (red: glutamatergic, black: glycinergic, “+” sign-preserving, and “−“sign-inverting), red zigzag: electrical synapses (Cx36), PRL: photoreceptor layer, OPL: outer plexiform layer, INL: inner nuclear layer, IPL: inner plexiform layer (a: sublamina a, b: sublamina b), GCL: ganglion cell layer. Tentative correlations between anatomical BC types (B1–7 and RB, in black letters) and physiological BC types are given. Rod pathways that operate in scotopic conditions are colored pink and marked 1–3: (1) rod-DBCR-AII-DBCC/HBCC-ONGC/OFFGC, (2) rod↔cone→DBCC/HBCC-ONGC/OFFGC and (3) rod-DBCC/HBCC-ONGC/OFFGC. Cone pathways that operate in photopic conditions are colored yellow and marked 1’−3’: (1’) cone-DBCC/HBCC - ONGC/OFFGC, (2’) cone-rod-DBCR-AII-DBCC /HBCC-ONGC/OFFGC, and (3’) cone-DBCR-AII - DBCC/HBCC-ONGC/OFFGC. GC-GC couplings are marked as 4. Active cells are marked with full colors and inactive cells are with unsaturated colors. Pathway suppressions in Bhlhb4−/−, Tra−/−, Gnat2cpfl3 and Cx36−/− mice are marked by pink, blue, black and green “X”s, respectively. Pink and green arrows indicate decreased AIIAC responses in the in Bhlhb4−/− and Cx36−/− mice.

