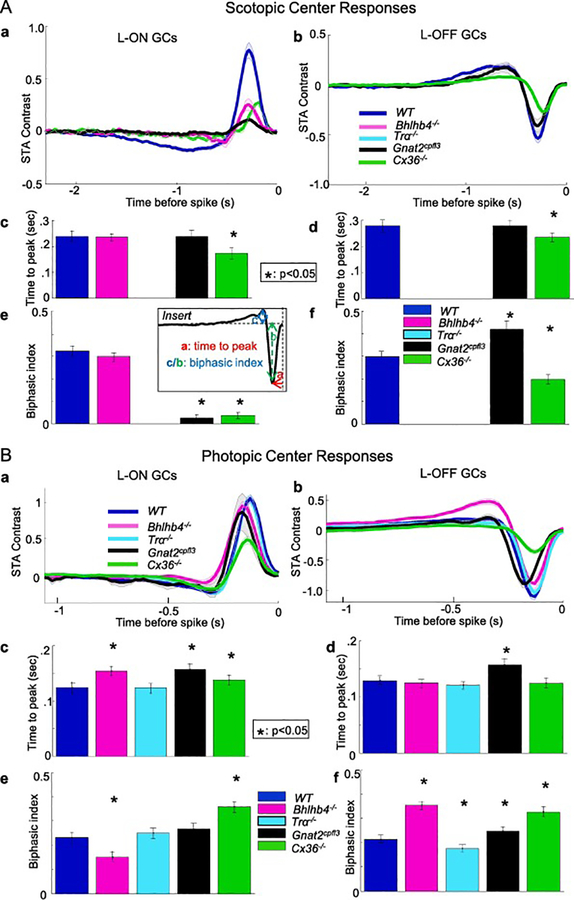
Figure 3.
Mean receptive field center STAs, TTPs and BIs of L-ON GCs and L-OFF GCs in WT, Bhlhb4−/−, Gnat2cpfl3, Tra−/− and Cx36−/− mice under scotopic (A) and photopic (B) conditions. Tra−/− mice had no cells with responsive STAs in scotopic conditions. Bhlhb4−/− mice had no OFF cells with responsive STAs in scotopic conditions. Mean STAs are shown as thick traces (averaged over numbers of GCs listed in columns 4 and 5 of Table 1, shaded area represents +/− two standard errors) in Figure 3Aa and 3Ba. Figures 3Acd and 3Bcd are the average TTPs (averaged over numbers of GCs listed in columns 4 and 5 of Table 1, TTP values are listed in columns 4 and 5 of Table 2) of L-ON and L-OFF GCs under scotopic and photopic conditions in the five mouse strains. In ON cells, Bhlhb4−/− GCs have a longer time-to-peak than wild type (0.154 vs. 0.125 seconds control, p = 2.8e-10, KS test), as did Gnat2cpfl3 GCs (0.157 vs. 0.125 seconds, p = 1.09e-4, KS test), while Tra−/− ON GCs were unaffected. In OFF cells, those from Gnat2cpfl3 mice had a longer time to peak (−0.157 vs. −0.129 seconds in control, p = 3.6e-15, KS test), while those from Bhlhb4−/−,Tra−/− and Cx36−/− mice showed no difference in TTP. Error bars represent 1 standard deviation. * indicates p< 0.05 (KS test). Figures 3Aef and 3Bef are the average BIs (averaged over numbers of GCs listed in columns 4 and 5 of Table 1, BI values are listed in columns 6 and 7 of Table 2) of L-ON and L-OFF GCs under scotopic and photopic conditions in the five mouse strains. Among ON cells, Bhlhb4−/− GCs were significantly less biphasic (0.151 vs. 0.232 in control, p = 1.8e-11, KS test) and Cx36−/− GCs are more biphasic. In OFF cells (Figure 3D), those from B4 mice were significantly more biphasic (.354 vs .214, p=7.1e-7, KS test), as were those from Gnat2cpfl3 and Cx36−/− mice (0.247 vs. 0.214, p=.0064, KS test), but those from Tra−/− mice were slightly less biphasic (0.177 vs. 0.232 p = .037, KS test). Error bars represent 1 standard deviation. * indicates p< 0.05 (KS test).

