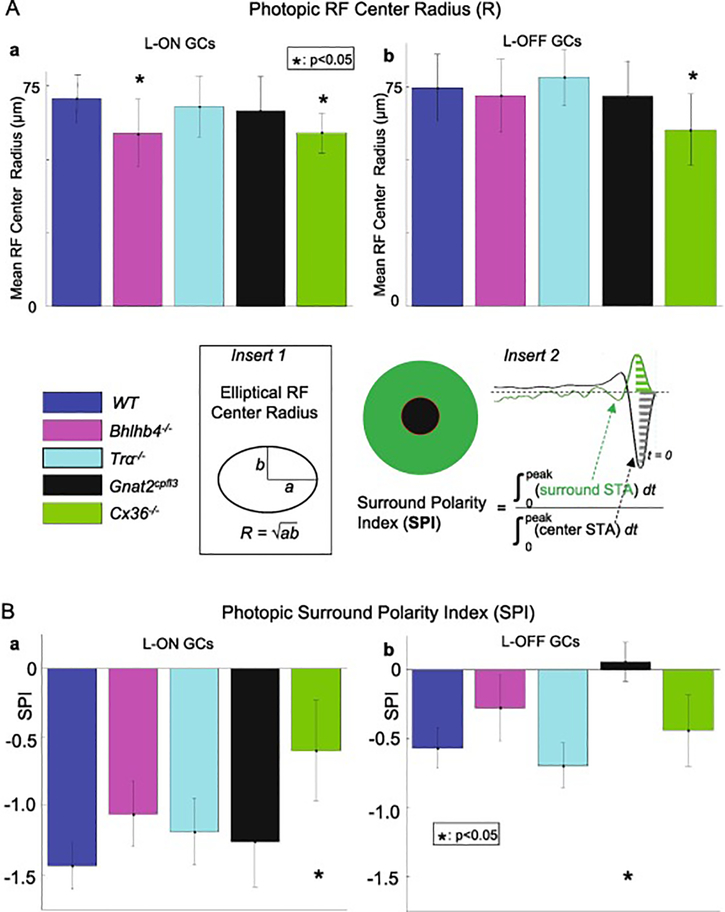
Figure 4.
4Aab are the average RFC radii (R) (averaged over numbers of GCs listed in columns 4 and 5 of Table 1, R values are listed in columns 8 of Table 2) of L-ON and L-OFF GCs under photopic conditions in the five mouse strains. The average RF center radius of ON cells from Bhlhb4−/− mice were significantly smaller than those of wild-type mice (64.7 um vs 70.6 um, p =0.018, KS test), while the RF center radius of OFF Bhlhb4−/− cells was not significantly different (71.9 um vs. 74.6 um, p = 0.43, t-test). The RF center radius of both ON and OFF cells from Cx36−/− mice were significantly smaller than those of wild-type mice (64.7 um vs 70.6 um, p =0.018, KS test). Error bars represent 1 standard deviation. * indicates p< 0.05 (Kolmogorov-Smirnov test). Figure 4Bab show the average surround polarity index (SPI) (averaged over numbers of GCs listed in columns 4 and 5 of Table 1, SPI values are listed in columns 9 of Table 2) of L-ON and L-OFF GCs under photopic conditions in the five mouse strains. Cx36−/− ON GCs and Gnat2cpfl3 OFF cells showed statistically significant increases in SPI (0.006 vs, −0.057 in control, p= 3.9e-4). On the other hand, we found no significant change in SPI for Bhlhb4−/− or Tra−/− GCs. Error bars represent 1 standard deviation. * indicates p<0.05 (KS test).

