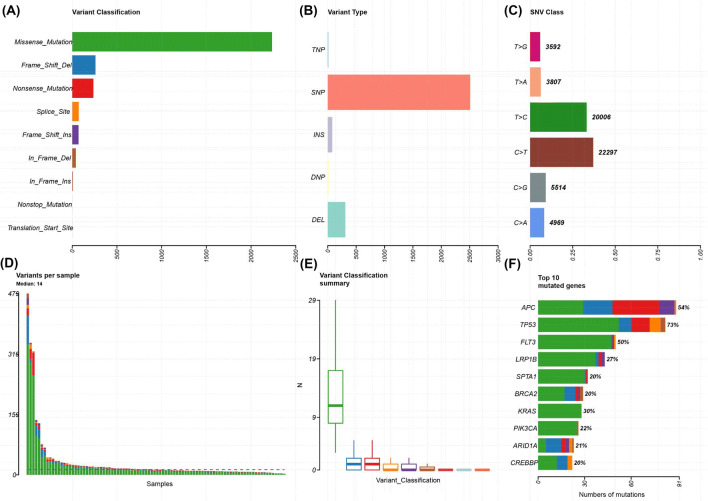
Fig. 1.
Plot of variant classification for all samples using TSO500. a Total number of variants detected by variant classification. b Total number of variants detected by variant type. c Total number of variants detected by SNV class. d Number of variants per sample. e Box plot of the number of variants within each classification per sample. f Top 10 mutated genes. For d–f, the colours are equivalent to a. DEL deletion, DNP dinucleotide polymorphism, INS insertion, SNP single-nucleotide polymorphism, SNV single-nucleotide variant, TNP trinucleotide polymorphism, TSO500 TruSight Oncology 500

