FIGURE 1.
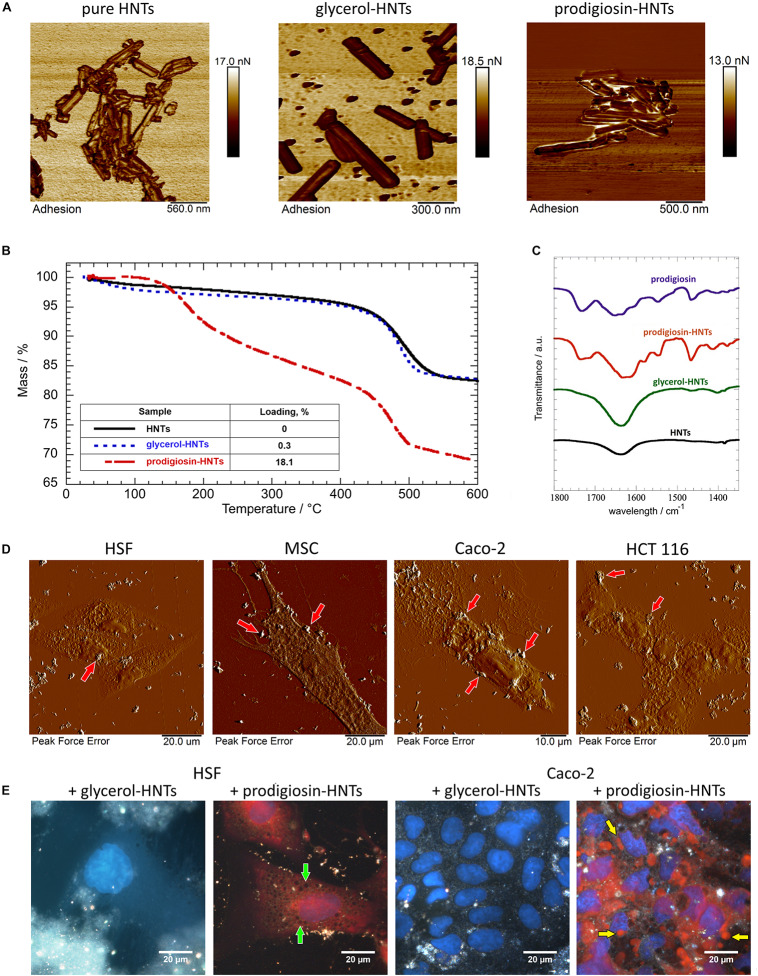
Characterization of prodigiosin-HNTs. Atomic force microscopy images (A) of pure HNTs and loaded with glycerol and prodigiosin, demonstrating the change of nanotubes surfaces adhesiveness. TGA analysis (B) of prodigiosin-loaded HNTs demonstrated that this complex contains 18% of prodigiosin. FT-IR spectra (C) in the wavelength range between 1350 and 1800 cm–1. AFM images of the cells (D) indicate that hydrophobic prodigiosin-HNTs strongly attach to the cell membrane, forming large clusters. (E) prodigiosin exhibits autofluorescence, therefore its leakage from the nanotubes and the presence in the cytoplasm can be visualized using fluorescence module of hyperspectral microscope CytoViva®. More details see in Supplementary Figure S4.

