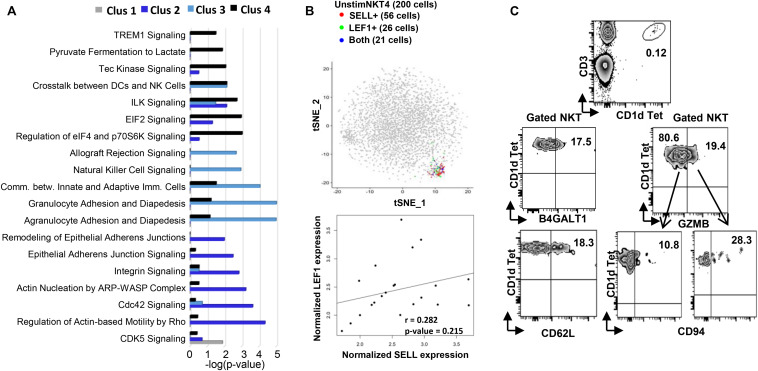
FIGURE 2.
Flow cytometry and Ingenuity Pathway Analysis confirming the existence and functional prediction of the steady state human NKT clusters. (A) Ingenuity pathway analysis (IPA) of differentially expressed genes in individual clusters. Pathway enrichment is expressed as the –log (p-value) adjusted for multiple comparison (B) up plot: t-SNE analysis of SELL and LEF1 co-expression in unstimC4 NKT cells; lower plot: SELL and LEF1 expression correlation analysis in the cells expressing both. (C) Flow cytometry analysis to confirm the existence of human PBMC NKT clusters identified by scRNA-seq. Flow plots of NKT cells from PBMCs showing the expression of B4GALT1 and CD62L (SELL), respectively; and the co-expression of GZMB and CD94 (KLRD1).

