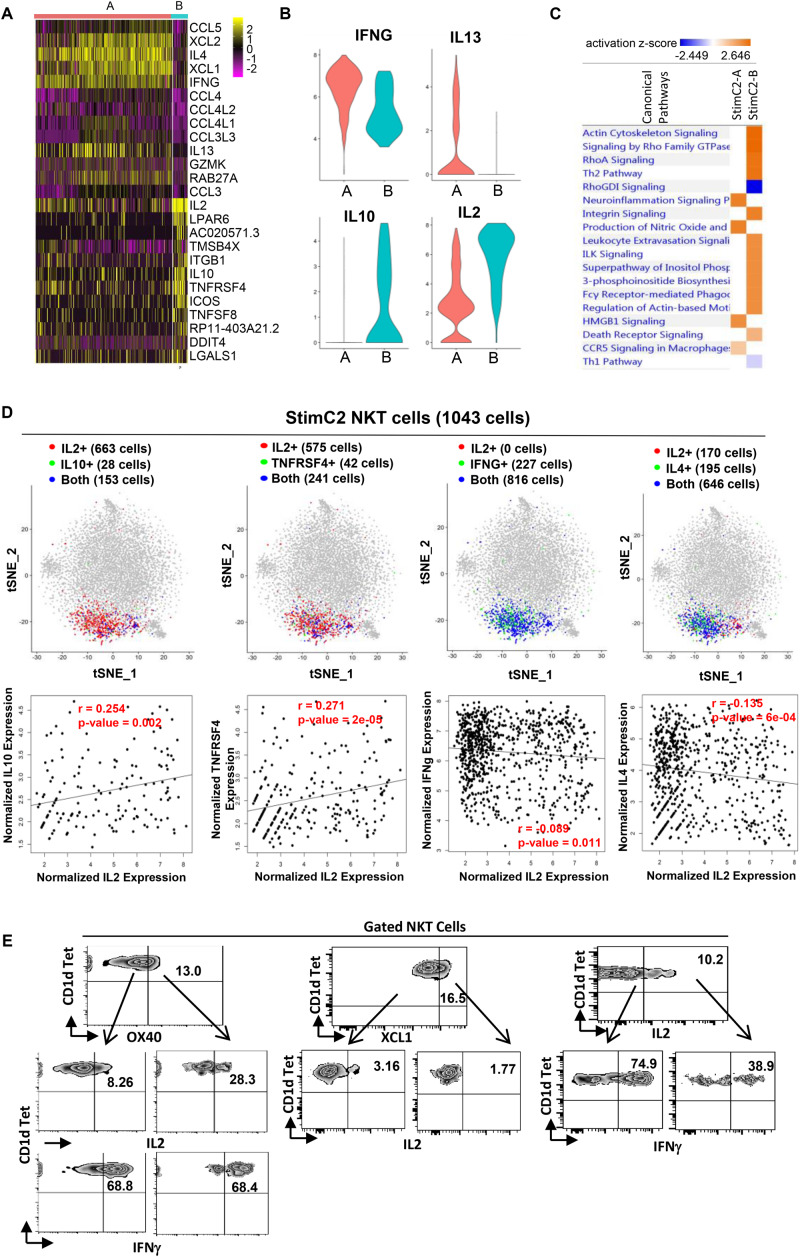
FIGURE 4.
Sub-cluster of stimulated cytokines expressing NKT cells showed regulatory T cell phenotype. (A) Heatmap of the discriminative gene sets defining the two sub-clusters within the stimulated cluster two NKT cells. (B) Violin plots showing the expression distribution of candidate genes across two sub-clusters of NKT cells (orange for StimC2-A; blue for StimC2-B). (C) Ingenuine pathway analysis (IPA) of differentially expressed genes in the two sub-cluster NKT cells. Pathway enrichment in individual clusters is expressed as activation z-score shown in the heatmap. (D) The IL2/IL10, IL2/TNFRSF4, IL2/IFNγ and IL2/IL4 gene pair co-expression analysis (upper panel), and the gene expression correlation analysis (lower panel) in cells expressing both genes in StimC2 NKT cells. (E) Representative flow cytometry plots of NKT cells gated from PMA/ionomycin stimulated PBMCs, depicting the co-expression of OX40 (TNFRSF4)/IL2; OX40 (TNFRSF4)/IFNγ; XCL1/IL2; IL2/IFNγ.

