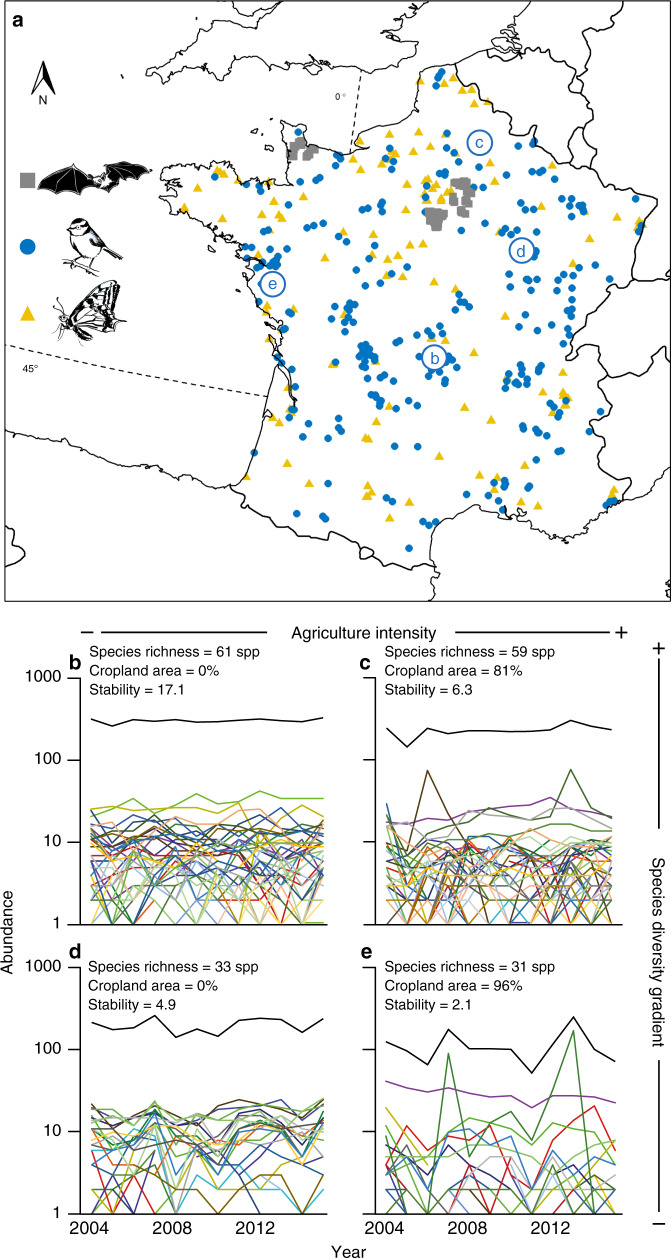
Fig. 1. Datasets.
a Spatial distribution of the monitored bat, bird and butterfly communities across France. Circled letters correspond to the bird communities with contrasted levels of species richness and cropland area within buffer plotted in (b–e). Each colored line represents a given species abundance time series and black lines represent total community abundance time series. Species richness, cropland area within buffer, and stability (computed as the inverse of the coefficient of variation) of the total community abundance time series are given for each bird community.

